
The 2016 U.S. Presidential Election taught us many things. But Karen Webster said that it mostly taught us what can happen when the right people use the wrong data to make big decisions. She lays out the seven deadly data sins that she said contributed to what most in the media, as well as the Clinton and Trump campaigns, characterized as a very big November surprise. The same seven deadly data sins that can derail the decisions that underpin every decision made in an era of great disruption , uncertainty and innovation. Which, in case you haven’t noticed, is payments and commerce – big time.
November 8, 2016, was not a very good day for Big Data.
“If you believe in Big Data analytics, it’s time to begin planning for a Hillary Clinton presidency and all that entails … While the public polling has been close, the data crunchers are quietly confident in a different narrative. Occasionally, that confidence is on full display through operatives like David Plouffe, who is predicting a Trump walloping.” Forbes, Aug. 5, 2016
 It was also not a very good day for anyone who made big bets based on the prognostications of the Big Data number-crunching machines that had been working full-tilt since Hillary Clinton and Donald Trump became their respective parties’ presidential nominees last summer. Consistently, and using some of the most sophisticated predictive analytics tools in the world, as New York Times columnist Frank Bruni wrote on Friday (Nov. 11), the world was all but certain of the outcome of the 2016 American election.
“FiveThirtyEight’s polls-only model puts Clinton’s chances at 85 percent, while our polls-plus model has her at 83 percent. Those odds have been pretty steady over the past week or two, although if you squint you can see the race tightening just the slightest bit, with Clinton’s popular vote lead at 6.2 percentage points as compared to 7.1 points a week earlier. Still, she wouldn’t seem to have a lot to complain about. So, while we show a greater likelihood of a Trump win than most other models, we’d also assign a greater possibility to a Clinton landslide, in which she wins the election by double digits.” Nate Silver, FiveThirtyEight blog, Oct. 24, 2016
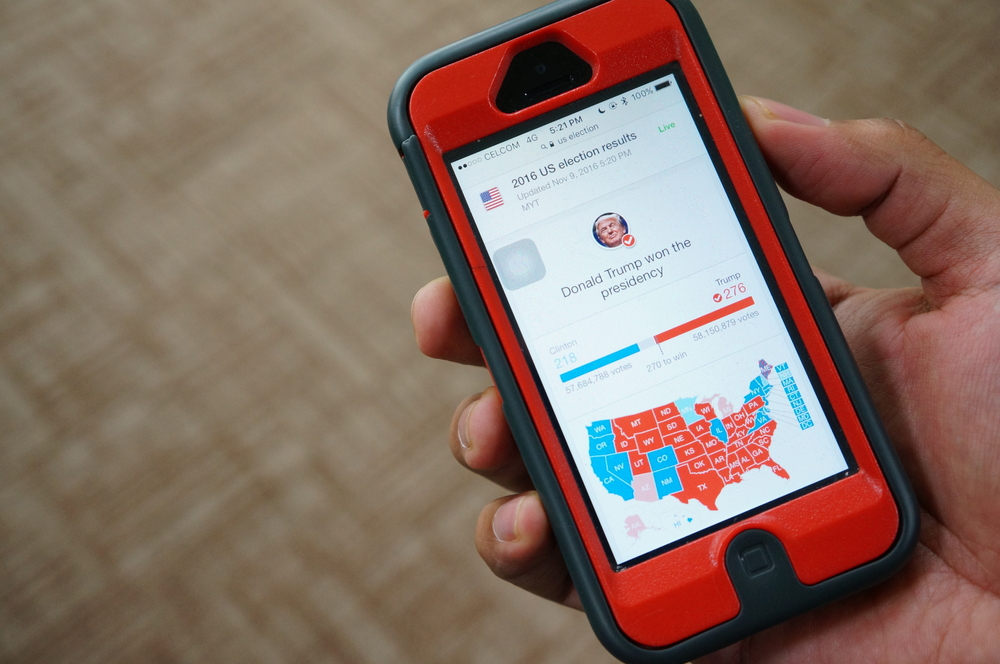
Two weeks and a day later, roughly 60 million Americans went to the polls in the American election and elected Donald J. Trump the 45th President of the United States.
There are now, of course, tons of articles and Monday-morning quarterbacking about what every media outlet characterizes as the biggest political upset in history. Ironically, even Trump’s own data analytics team — a team that had zeroed in on some telltales over the summer that gave them an inkling that winning wasn’t totally impossible or implausible — admitted to being surprised.
How did the predictors and the pundits who collectively spent tens (hundreds?) of millions of dollars collecting and analyzing data get sucker-punched on Tuesday evening?
By falling prey to the Seven Deadly Data Sins.
The same deadly data sins that can trip up everyone in payments and commerce-land — and even has. Here’s what they are — and how to avoid them.

Source: Gallup
The Gallup Organization has been asking Americans their opinions on the outcome of the American election for president since 1936. And the techniques that it has been using to do that haven’t changed much, if at all, in those 80 years — calling people on the telephone to ask them who they’re most likely to vote for and why.
Eighty years ago, that seemed like the logical thing to do. Between the 1940s and 1970s, the percentage of households with landline phones climbed from 36.9 percent in the 1940s, to 61.8 percent in the 50s, to 90.5 percent in the 1970s. What’s more, there was generally someone home to answer the friendly pollster’s call.
Eighty years later, a lot has changed. Nowadays, who answers calls from a number they don’t recognize? And if they do, politely (or not), how many give a pollster the brush-off without answering any questions?
Pew Research says that, 91 percent of the time, people either don’t answer the phone or don’t give the pollster the time of day. That leaves a whole 9 percent of people who participate in telephone-based polls and provide the data foundation for which poll predictions are made.
Predictions where the errors of 2–3 percent actually matter a lot.
Today, pollsters’ calls increasingly come to homes that still have landlines — 62 percent of the U.S. population still have one — but fewer than half of those households use them. Anyone a consumer really wants to talk to they do by calling their mobile phone. That means that calls that come to landline phones are mostly — you guessed it — marketing calls or pollsters.
That also means that the universe of people that pollsters talk to has become quite narrow: people with landlines (pollsters aren’t able to robocall mobile phones because they may incur a data charge), who are home and who answer the phone. The fewer people there are in the top of that funnel means that the 9 percent that end up answering the phone and talking to pollsters are probably not that representative of the general populace — and clearly not reliable when the outcome can swing on a point or two on either side.
I mean, seriously, who are these people?
It’s why Gallup said it got it wrong in the American election in 2012 when it predicted that Romney would win the election 50 to 49 — Obama won 51 to 47 — and why, this year, it predicted Hillary would win with 46 percent of the vote to Trump’s 42.
Lesson: Making sure that you’re talking to the right people is about a lot of things — including the methods used to reach them. That matters, especially when the sampling error (AKA the margin of error) is small enough to swing the result one way or the other.
Let’s say that a pollster manages to get someone on the phone and engages them in a conversation. Depending on a lot of things — who’s around that person when they’re on the phone with the pollster, who the pollster is or how the questions are asked — it’s highly likely that he or she won’t answer truthfully.
In fact, some survey experts say that as many as half of people surveyed give an answer that really doesn’t reflect their true feelings on the question being asked.
Now, this is not because people are inherently dishonest. Lots of times, people don’t answer truthfully because they don’t understand the question they’re asked. Survey design is a science, and in the day and age of do-it-yourself survey tools that let anyone be a survey “expert,” survey questions can lack enough precision and clarity for consumers to produce any kind of an answer that anyone would want to stake any decision on.
Sometimes, the questions lack enough context for answers to be credible or are ambiguously worded. Sometimes, people don’t really remember what they did with enough precision for the answers to be reliable.
Other times, people answer a question the way they think they are supposed to — which can throw a huge red herring into the data pile.
That’s what happened this American election cycle for president.
This election’s red herring was the unwillingness of people to admit to voting for Trump — even after they might have pulled the lever for him. Patriot QB Tom Brady won’t admit publicly to voting for (or against) Trump, after Trump said a week ago in a New Hampshire rally that Brady had given him his support. Gisele says he didn’t, and Tom’s not saying anything.
What many people did instead was put Trump signs in their windows and in their front yards. Over the last few weeks of the campaign, more and more reported seeing more and more Trump signs in the suburban and rural areas of traditionally Blue States. The weekend before the election, Clinton supporters in New Hampshire expressed real concern over seeing more and more Trump signs turn up where they’d never seen them before. Not campaign-issued, professionally produced signs but homemade signs expressing support for now President-elect Trump.
Clinton won New Hampshire’s four electoral votes but by only 2,687 votes (out of the 731,838 cast).
Lesson: What people do can be much more of a reliable predictor of what people say they will do. This is particularly true in times of great disruption when consumers feel a great deal of uncertainty — and even anxiety — over what the “right” answer should be.
You’ve no doubt heard the old adage about assuming … and what it really means. When data models are built on top of bad assumptions, the outcomes of those models live up to the meaning of the word.
This American election cycle, prediction models were built on top of two very flawed assumptions:
The first is that people who had voted in past elections would vote the same way they always had. That assumed that the working-class, blue-collar, union workers would turn out for Clinton as they always had and had done for Obama the two elections before. And even that Republicans would always vote for the R candidate.
As we know now, many decided to switch parties, at least at the top, to vote for Trump, including some who voted for Obama in 2008 and 2012. Models never considered the impact of a “crossover” vote — or enough of one to change their outcomes.
The second flaw was assuming that the Clinton campaign would mobilize voters in the same way that Obama did four and eight years before — particularly since POTUS and FLOTUS were visible and active campaigners for her on the trail.
That didn’t happen.
Despite high, early voter turnout, it’s been reported that voter turnout overall was down this year — only 57 percent of eligible voters went to the polls versus 58.6 percent in 2012 and 61.6 percent in 2008.
But what turned out to be the death knell for Clinton was this: NPR reported that, even though 1.9 million fewer people voted for Trump as voted for Romney in 2012, 6.8 million fewer people voted for Clinton than Obama in 2012.
Lesson: Building static models in dynamic environments yields bad outcomes. Models that ignore how people might react to macro- or micro-shocks only reinforce flawed assumptions.
Even though Big Data was hailed as the secret weapon for predicting the outcome of the 2016 presidential election, relying only on Big Data was how pollsters and campaign operatives misread the breadcrumbs that voters were dropping for them.

Source: Amazon
“Big Data for Dummies” defines Big Data as being all about the four Vs: Volume (as in tons of data points all being mashed up), Velocity (as in the frequency of which this mass of data comes in), Veracity (as in the reliability of the data sources and data that comes in) and Variety (as in the number of different sources used to get data). Those four Vs — all mashed up — allow efforts to be targeted and messages to be directed precisely to that target audience.
And that works great when what comes out the other end is the right target of opportunity — at scale.
What we learned from this election is that relying exclusively on “Big Data” can miss the gold often hidden in some much smaller and much different data pockets. The election was, more or less, decided by how 107,000 people in Clinton’s three “firewall” states — .09 percent of all votes cast — cast their votes.
Take Wisconsin. No Republican had won Wisconsin in 32 years. Clinton’s Big Data machine was so confident that she would win Wisconsin that she never even visited the state — the first Democratic candidate since 1972 not to make a campaign appearance there. She was up by six points a week before. Trump won 22 counties that Obama had carried four years ago, and the state turned on 28,000 voters — all from rural counties.
Big Data models also said Clinton would win Michigan — a Blue State with a big union base. Mitt Romney lost Michigan in 2012 by nearly 10 points — despite his father being the governor there once upon a time. Trump ended up carrying more than a dozen counties that Obama won in 2012 — and 11,837 votes put him over the top.
In Pennsylvania, the home of the Democratic National Convention and a state that hadn’t voted for a Republican since 1988, the result was the same. Clinton swept Philly and the surrounding suburbs, but it was not enough to blunt Trump’s support in the rural outposts. He carried 56 of the state’s 67 counties, and 68,236 votes turned that Blue State, Red.
The story was repeated in a number of Blue States and many of the 14 swing states in which voter turnout was a record 65-plus percent. Big Data models simply missed how a handful of voters in a handful of small counties that no one was targeting with their polling or predictive models could change the election outcome so dramatically.
Companies are starting to see the shortcomings of a Big Data-all-the-time strategy, too. P&G said this summer that it would dial back its Big Data-driven initiatives on Facebook — where billions of data points are harvested to target, with precision, the Facebook news feeds of likely buyers. It found that sales suffered since such a strategy left out the people who didn’t fit a particular profile but might buy the product anyway. Since adjusting its strategy in that way, sales are up — and it’s opting for a much broader strategy moving forward across many of its media channels.
Lesson: Big Data doesn’t always deliver better data — or results. All the algorithms in the world can’t overcome flaws in sampling or targeting criteria that can make the output of Big Data exercises unreliable — and undiscoverable — until it is too late.
There’s a lot of data floating around the ether these days — and a lot of it isn’t worth the keystrokes used to produce the press releases that flaunt it. And this election cycle, consumers were presented with so much data that most people turned numb to it. Polls contradicted each other; prediction markets were all over the place.
The result: No one really, really understood how close the election really was — for the better part of the last year.
Let’s start with the whole notion of prediction markets. Prediction markets place odds on the certainty of an outcome. In 2012, the prediction markets had the odds of Obama winning a second term at 99 percent. That was like saying that Obama had a 99 percent chance of winning the presidential lottery.
So, when the prediction markets this year had the odds of Clinton winning at 70 percent, that also meant that they gave Donald Trump a 30 percent chance of winning the election — a three out of 10 shot.
Put another way, economists and data scientists weren’t at all surprised when Trump pulled off his upset.
Then, there’s the margin of error — or sampling error. When the pollsters reported that Clinton had 47 percent and Trump had a 44 percent chance of winning with a margin of error of +/- 3 percent, that meant there was a six-point swing either way for either one of them — making the election more or less a tossup.
Some pollsters have gone so far as to say the margin of error in polling can be +/- six or seven points, which suggests a 12–13 point swing — more or less anyone’s guess based on all of the other factors I’ve already mentioned.
And that’s pretty much how the polls went for most of the election — Clinton/Trump separated by three to six points — making it anything but a sure thing for Clinton, statistically speaking.
Lesson: Prediction markets and polls are all about probabilities, not about certainties. So, you shouldn’t be too surprised when they are wrong. In fact, the whole statistical idea behind these methods is that, some fraction of the time, they will be wrong. This always means you shouldn’t throw out these methods just because they give the “wrong” result — hey, the prediction markets said Trump had about a 30 percent chance of winning; those are pretty good odds.
In times of certainty, maybe it’s possible that 9 percent of people that are reached by pollsters could directionally get things more or less right.
But not when times are anything but certain and in an election cycle in which two candidates offer two very different views on how they’ll make things better — and for whom.
That’s the environment that characterized the 2016 presidential election. A divided electorate and a very atypical campaign that played out in real time on social media and across every cable channel 24/7 over the course of 18 months.
That very divided electorate was presented with two very different candidates who each brought a lot of personal baggage along with them. Never before had two candidates had such high unfavorable ratings, nor had so many people expressed the sentiment that their vote wasn’t as much a vote for one person then a vote for the lesser of two evils.
So, that’s what pollsters factored into their models: Clinton was unlikable but less unlikable than Trump — or so they assumed.
But as Salena Zito wrote this summer in The Atlantic, the press takes Trump literally, but not seriously; Trump supporters take him seriously, but not literally. What seemed to drive supporters to put signs on their lawns and vote R and not D was the cumulative effect of the disruption that working-class, predominantly blue-collar voters have felt since the financial crisis. And it didn’t take many to tip the scales in Trump’s favor. Those voters wanted change as much as Obama’s supporters did back in 2008 — even if it meant voting this time for someone who said outrageous and insulting things throughout the course of the campaign.
Lesson: In times of disruption, the flip side of innovation, the traditional bets are off. Consumers make decisions on the one or two things that will help them overcome the big frictions in their lives — even if that means trading off things that “most people” wouldn’t.
I’ve written a bunch of stuff on the dangers of groupthink — going along with what other like-minded cool kids are doing and believing that’s what good for the cool kids is what’s good for everyone. Who shouldn’t want to be just like the cool kids?
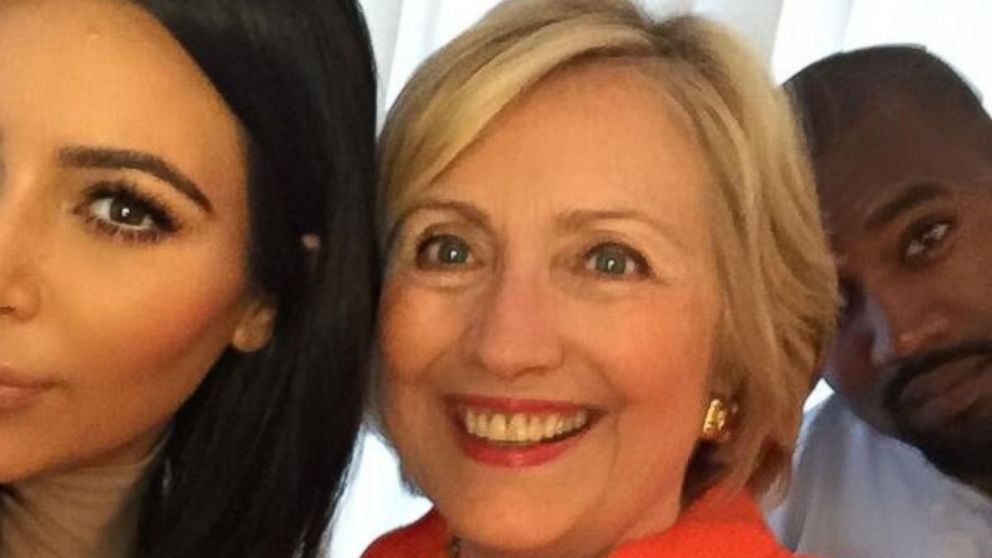
Source: Kim Kardashian Twitter
The cool kids got on board the Clinton campaign, en masse. Kimye, Eva, Beyonce, Katy Perry, Jay Z, Oprah, Bruce Springsteen and a host of other celebrities and athletes came out in force for Clinton. More than 100 high-profile tech execs publicly pledged their support, too. Frank Bruni wrote last Friday that, for the last year, the media and Democratic operatives talked among themselves that a Clinton as a candidate was invincible given the opponent she faced. And America had elected its first African-American president, so electing the first female president — one with more than 20 years of public service and who most recently served as secretary of state — was an inevitable next step.
There was only one thing wrong with all of this: These group-thinkers were concentrated primarily in the big cities on both coasts. The part of the country that we all fly over on our way to and from Boston and New York to San Francisco and Seattle didn’t buy into much of it. And the group-thinkers never saw it coming because they couldn’t fathom how anyone could — or should — want anything different than what they did.
Lesson: Identifying early adopters — and then going after them — is one thing. Making decisions on the basis of the actions of a small group of like-minded people risks alienating the large swath of consumers everyone needs to get a new product or service to scale.
These seven deadly data sins didn’t just surprise the Clinton campaign — and, apparently, the Trump campaign, too — they can also impede the success of many new innovations that entrepreneurs want to bring to market.
Groupthink asserts that what’s good for like-minded techies will work for Joe and Jean Middle America — when it doesn’t solve any of their real problems.
Bad survey design produces questions like “How important is security to mobile payments?” and press releases that report that 82 percent of consumers want a secure way to pay. Remarkable.
Sample bias — along with bad survey design — results in assertions that “consumers” think one thing when not enough of the right ones were asked to draw any kind of reliable conclusion.
Bad data analysis distorts the impact of the survey conclusions — when confidence levels and margins of error are too high to deliver good business insights and models are built on a set of assumptions that have not been tested.
Anyone now with a SurveyMonkey account can ask 100 people anything about anything and get it published somewhere, resulting in an overload of data that means nothing or, worse, takes people down the wrong path. A post in Facebook’s news feed over the summer from a news source no one’s ever heard of reported that the Pope endorsed Donald Trump. It wasn’t true, but it was shared over a million times.
Bottom line here…
In an era where there is more data, and data exhaust, being produced and not less, it’s time to step back and be more responsible with how data studies are done and how data is presented and used. It’s not wrong to want good data on which to base great decision-making.
But it can be a tragedy when otherwise good data falls victim to bad data practices.
We’re always on the lookout for opportunities to partner with innovators and disruptors.
Learn More