Ever wonder really how money flows between businesses cross border? Well, you sort of need a scorecard given its complexity, number of payments methods and the role of new players in introducing new options. Here’s our take on just how it happens, region by region and payment method by payment method.
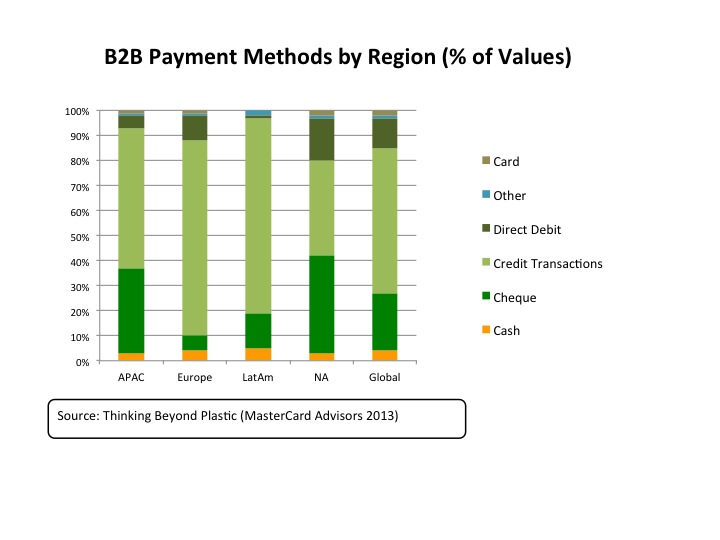
Surprise, surprise, on a global basis, credit transactions, checks and direct debits are the most commonly used B2B payment methods. A 2013 study by Master Card shows that credit transactions make up more than half of B2B spend value globally. Checks follow with a quarter of transactions; however, this situation is not similar across regions.
In Asia Pacific checks still represent a third of all B2B payments, a distant second to credit transactions which represent more than half. In the years after the financial crisis, Asia payment revenues have seen the largest gains and now have the largest market share globally (35.6 percent). Their main source revenues come from interests on deposits and payment fees. This is especially noteworthy given that Asia’s, and particularly China’s share in international trade, is increasing.
In Europe credit is the most commonly used method of payment between businesses, with checks accounting for only a third, after direct debits. In Latin America, credit transactions dominate all B2B payments.
Although in a slow decline, North America (NA) is the only region where checks remain one of the leading payment methods.
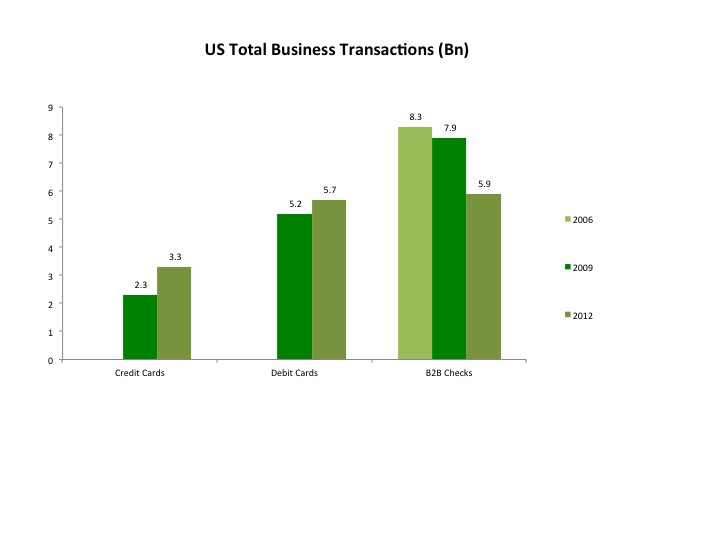 The 2013 Federal Reserve Payments Study provides additional details for US as it attempts to expand the use some payment methods between businesses and consumers. For example credit card drove 2.3B transactions in 2009 and 3.3B in 2012, a 12.8 percent CAGR. Total volume of transactions increased 17.4 percent CAGR. Direct debit card use saw 5.7B transactions (vs. 5.2B in 2009, a 3.1 percent CAGR). Although there are not publicly available statistics for value of business transactions on debit cards, they usually carry much lower values than credit cards.
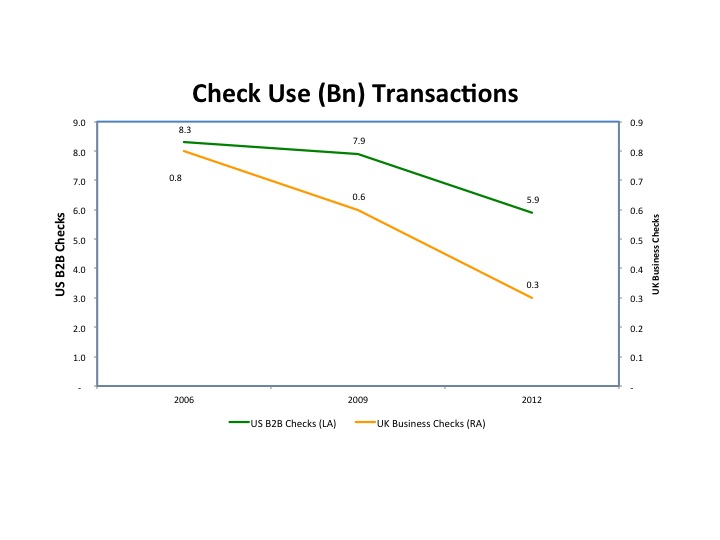
 Checks were used in 5.9B B2B transactions in 2012 (a -9.3% CAGR from 2009 when 7.9B checks were written). However, checks carried much larger values. We projected that the average B2B check average value to be USD3.6k (an 8.5 percent CAGR). As a result total B2B check transaction volumes remained flat.
Many facts point to a slowdown in the use of checks by businesses in US. The Federal Reserve Payments study shows 9B checks were written in 2012 (vs. 12.6B in 2009, a -10.6 percent CAGR). This illustrates an acceleration in the pace of decreasing check use as there were 13.9B business checks written in 2006 (2006-2009 CAGR was -3.2 percent). While B2B checks totaled 5.9B (-9.3 percent 2009-12 CAGR), B2C checks were 3.1B (-15.8 percent 2009-12 CAGR).
Further support in the decrease of check use is in the 2013 AFP Electronic Survey, which shows that although 50 percent of businesses still make most of their disbursements by check that is down from 57 percent in 2010 and 74 percent in 2007. Although these figures may seem contradictory with the Fed’s study, there are two explanations that could explain those facts. It is possible that firms which issue and receive more checks have proportionally reduced more their use of checks and/or that firms that didn’t have them as their primary payment option in 2010 decreased even more their use of the instrument.
Publicly available statistics on business use on other countries remains limited. For example, in UK there were .8B check transactions in 2006, .6B in 2009 and .3B in 2012.
 A British Council for Offices report shows that wholesale payment revenues reached $138B in 2012 globally, making it about a quarter of USD523B total payment revenues. Additionally, a McKinsey analysis shows that from 2006 to 2011 Latin America and APAC grew payment revenues at low double digits while North America and Europe and Middle East grew single digits, explained in part by the financial crisis. As a result, Asia Pacific increased 901 bps its share to reach 35.6% of global revenues, making it the leading region.
In the future, it is expected that payment methods for B2B transactions will change, especially with the development of faster payments. With the UK leading the way in same day bank money transfers and many counties including Singapore, Poland, Australia and the United States working to develop similar systems, more payments may be made with bank to bank transfers. As PYMNTS has seen, there has been an increasing amount of innovation and investments focused on the B2B space which may lead to new methods in the way that payments are made between businesses.
We’re always on the lookout for opportunities to partner with innovators and disruptors.
Learn More