
We tend to think of the stock market with a bit of mental shorthand.
How’d the Dow do?
The NASDAQ’s sputtering.
The S&P’s climbing a wall of worry.
We just mentioned three indexes, each with a different, general flavor (and the statements attached to each of them do not apply to any particular day of trading). The Dow is, of course, a marquee index of 30 companies: generally prominent firms, generally sporting large market caps. The NASDAQ is relatively highly-populated by tech companies. The S&P 500 offers a broad cross-section of industries.
But of course, in 2022, there are any number of ways to track any number of holdings across asset classes. Readers of this space no doubt know that just a few days ago we launched the Connected Economy 100™ (CE100™) Index, designed to track the performance of companies across 10 central pillars of everyday living.
Read Here: The CE100™ Index Identifies Top Performing Enablers Behind the Connected Economy
Now comes the debut of the FinTechIPO™ Index, designed to do two things:
Source: PYMNTS.com
Of course, any new index deserves an introduction and a bit of explanation as to its composition and mechanics in order to help investors understand its makeup — but also to validate its efficacy as a barometer. To that point, we offer the following:
Who?
The FinTechIPOTM Index examines FinTech firms that went public just before, and have gone public during, the pandemic that has (in some ways irreversibly) changes daily life through the past two years.
The average market cap, to date, we found, is $6 billion; the largest company as measured by capitalization is Nubank, at about $41 billion. The average return since IPO has been negative 14%.
What?
Breaking things down a bit (just “what” is in the index): The FinTechIPOTM Index begins with six firms that went public in the latter half of 2019 – including Bill.com, XP and others, setting an initial “base level” for what has followed. We have taken into account all of the companies that have gone public since, with a focus on software and infrastructure, banks and credit services.
2021 seems a banner year for FinTech IPOs, accounting for 26 listings of the 44 holdings in the index.
Why?
Here is the central question. An Index, focused on a basket of companies that – more or less – focused on shaking up payments, and some of the more traditional (perhaps even paper-based!) processes within finance, gives observers a clearer picture of how trends may be emerging and progressing. Revenue growth (and earnings) and stock movements may offer a proxy for that evolution; earnings season commentary will be illuminating, too.
When? We’ll look to update the Index weekly with company-specific news and discussion of outsized movements (up or down).
And of Course, How?
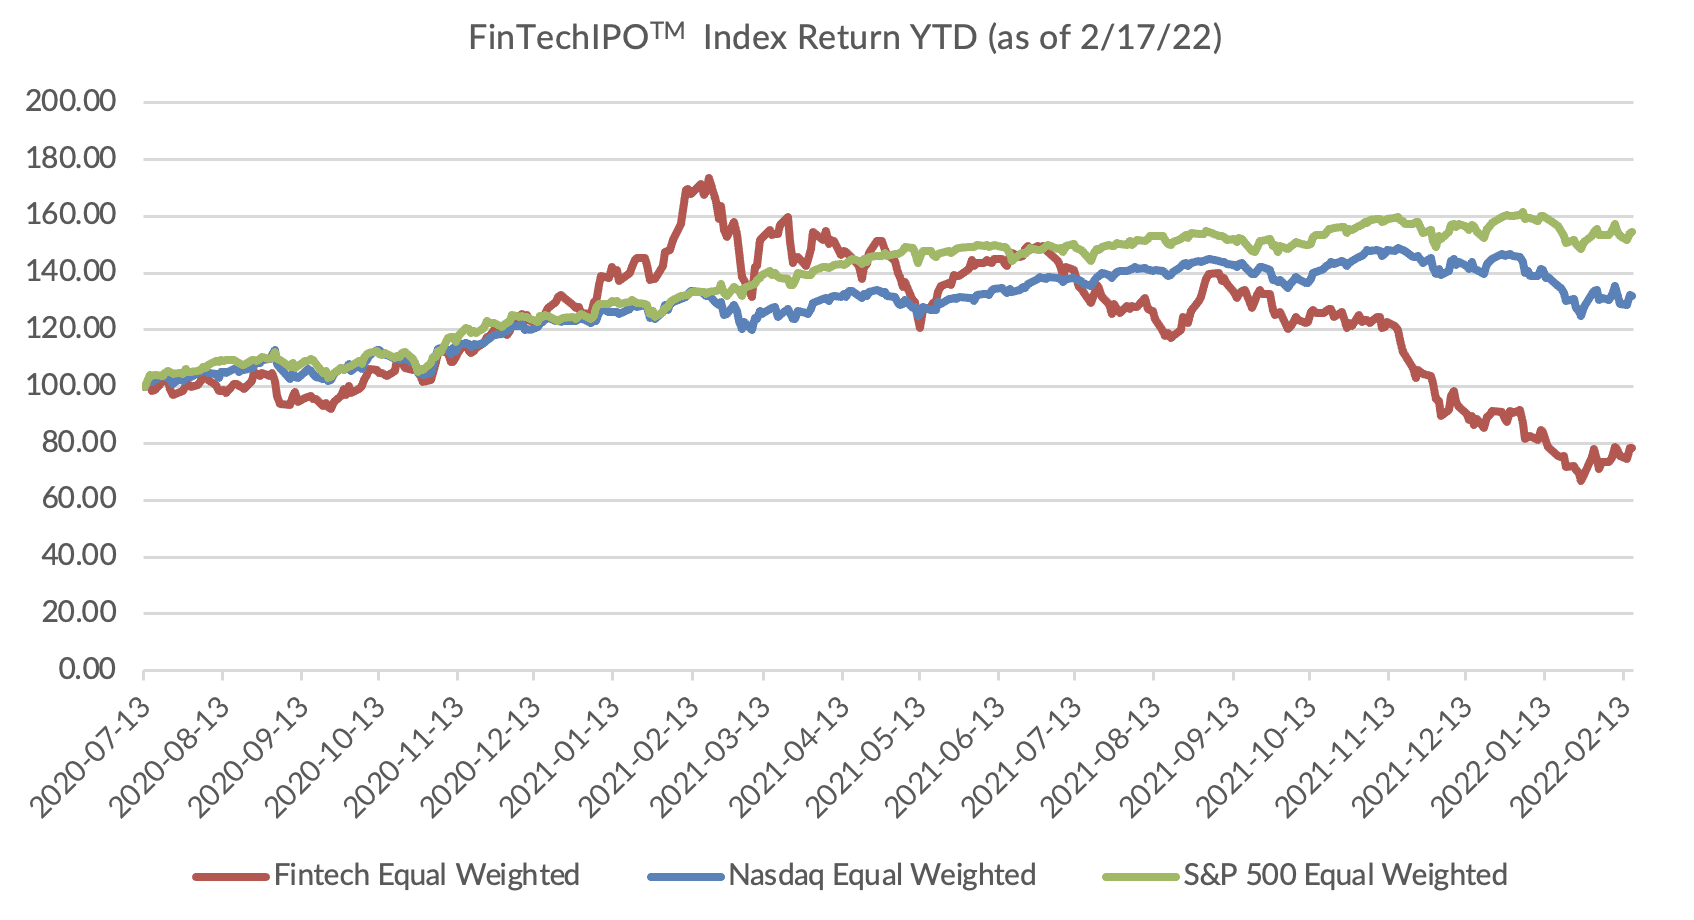
The FinTechIPOTM Index is equal weighted — and for comparison’s sake, the S&P and NASDAQ Indexes are also equal weighted — so that wild swings in market cap do not have an outsized impact on readings.
The initial set of six names that IPOed in 2019 offers a baseline, or “value” of 100 (the benchmark indices are plotted along the same metrics). You’ll see that in the latest readings, and year to date, the FinTechIPOTM Index has underperformed the market as a whole. The latest Index value of 78.2 gives a sense of performance, well below the early peak this year at about 168.
What Can We Tell So Far?
The fact that the average return since IPO for the 44 firms within the IPO Index has been negative 14% indicates, of course, that sentiment has been less than, well, sanguine. At least part of that downtrend can be traced to a macro environment that — no matter where you look — has become more uncertain than ever. The specter of rising rates, along with rising inflation, may raise concerns about how these relatively younger companies will grapple with pressures on operating margins, while the value of the cash they raised in the IPOs declines a bit.
But dig a bit deeper, and within the last few weeks we see some headlines that point to the ways and means in which these FinTechs are meeting those challenges.
As spotlighted earlier in the month, Nubank founder and CEO David Vélez sees the economic struggles of Brazil as a potential opportunity for even faster growth for his digital banking platform across Latin America and around the world.
In December, Nubank announced that its revenue doubled to $1.1 billion through September compared to the same time one year earlier, but its net losses jumped from $64.4 million to $99.1 million.
See also: FinTech Nubank Expects Growth Amid Brazil’s Economic Struggles
Elsewhere, Bill.com shares soared double-digit percentage points in the wake of earnings that topped the Street, where core revenues gained 197% year over year.
The Index will change and evolve over time — and so will the companies that are tracked. We’ll keep you posted at a high level, with discussions about how the index is performing, and at a micro (company-specific) level, too.

We’re always on the lookout for opportunities to partner with innovators and disruptors.
Learn More