
After analyzing 39,000 data points from 100 of the country’s top retailers over the last seven months, the verdict is in. There are just four key factors that separate the OmniReadi merchants from the rest. And the latest edition of the PYMNTS OmniReadi Index™, powered by Vantiv, breaks down the data and lays out what the best of the best do better than anyone else.
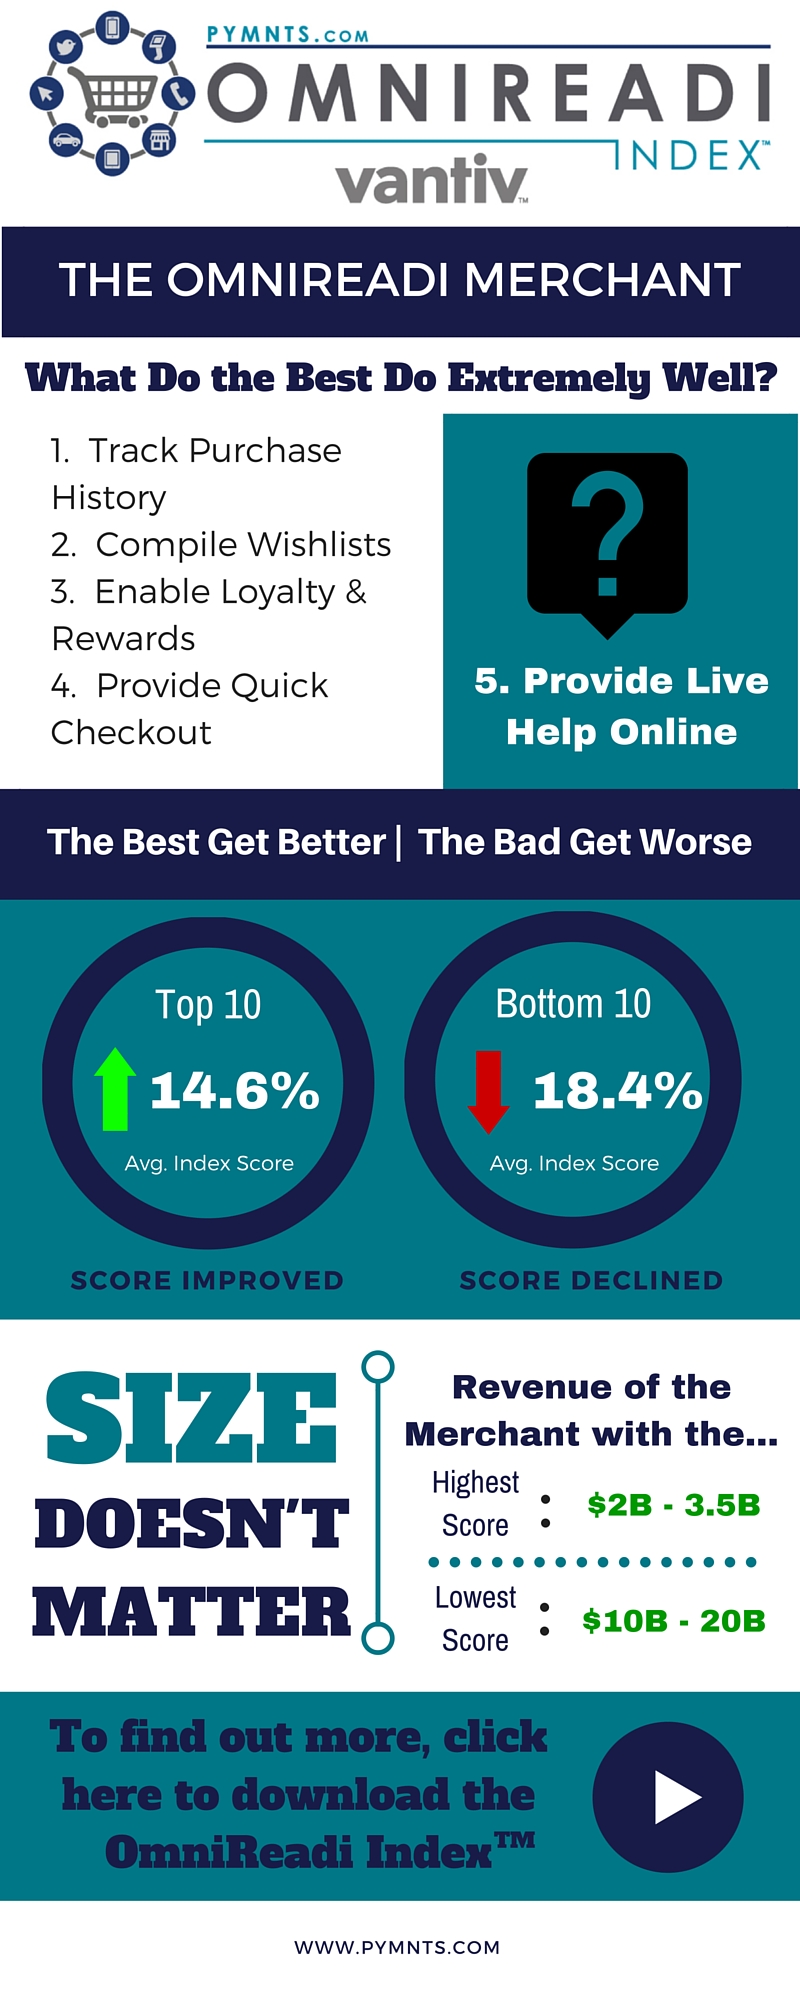
ShutterstockBeing “OmniReadi” – how effectively retailers are meeting consumers’ needs in a consistent and fluid way across online, in-store and mobile channels – is driven by four key attributes and one common theme.
Drumroll please …
And the common theme? Omnireadi merchants leverage their physical store assets to make in-app and online interactions richer and more valuable for the consumer.
The best of the best really do “get it.” We saw an unprecedented rate of change in the OmniReadi Index merchant score across the Top 100 U.S. retailers – an increase in the score of nearly 11 percent in just 7 months. The revolution in retail is underway and it’s clear that merchants are well aware of how important it is to offer seamless experiences to consumers across all of the channels in which they choose to shop.
But that’s the good news.
The gap between the “best” and the “bad” continues to widen as the best get better and those who aren’t, well, they continue to lose ground. And, “best” doesn’t mean “big” – some of the best performers are smaller in size, as the bigger guys continue to play catch up. Sporting goods retailers pop to the top, while food and pharma bring up the rear.
Key observations from this quarter’s report include:
The data for the January 2016 report shows that Index scores ranged from a (low) score of 15 to a (high) of 89. Overall, across all merchant categories, the average score is 71, a 10.9 percent improvement in the score over just 7 months, and a 4.4 percent improvement in the score compared to 4 months ago.
Considering the amount of time and how quickly the retail and payments landscape can change, the percentages say a lot in the OmniReadi IndexTM. For the Top 10 merchants analyzed, their collective Index scores increased from 81 last quarter to 87 this quarter.
For more updates from Vantiv, click here.
About The Index
The PYMNTS.com OmniReadi IndexTM, powered by Vantiv, provides a data-driven analysis on who’s helping merchants prepare to capture the omnicommerce opportunity. With a quantitative analysis of the Top 100 retailers across the U.S., which account for almost 50 percent of total U.S. retail sales, the OmniReadi IndexTM is a definitive guidepost for navigating the global marketplace.

We’re always on the lookout for opportunities to partner with innovators and disruptors.
Learn More