
June 2026
Share of Wallet: Amazon vs. Walmart

The Basket Breakaway: How Amazon Is Turning Walmart’s Store Traffic Into a Retail Weakness

New PYMNTS Intelligence data shows that the weekly grocery run brings shoppers to Walmart’s door—and then Amazon takes the rest of the basket.

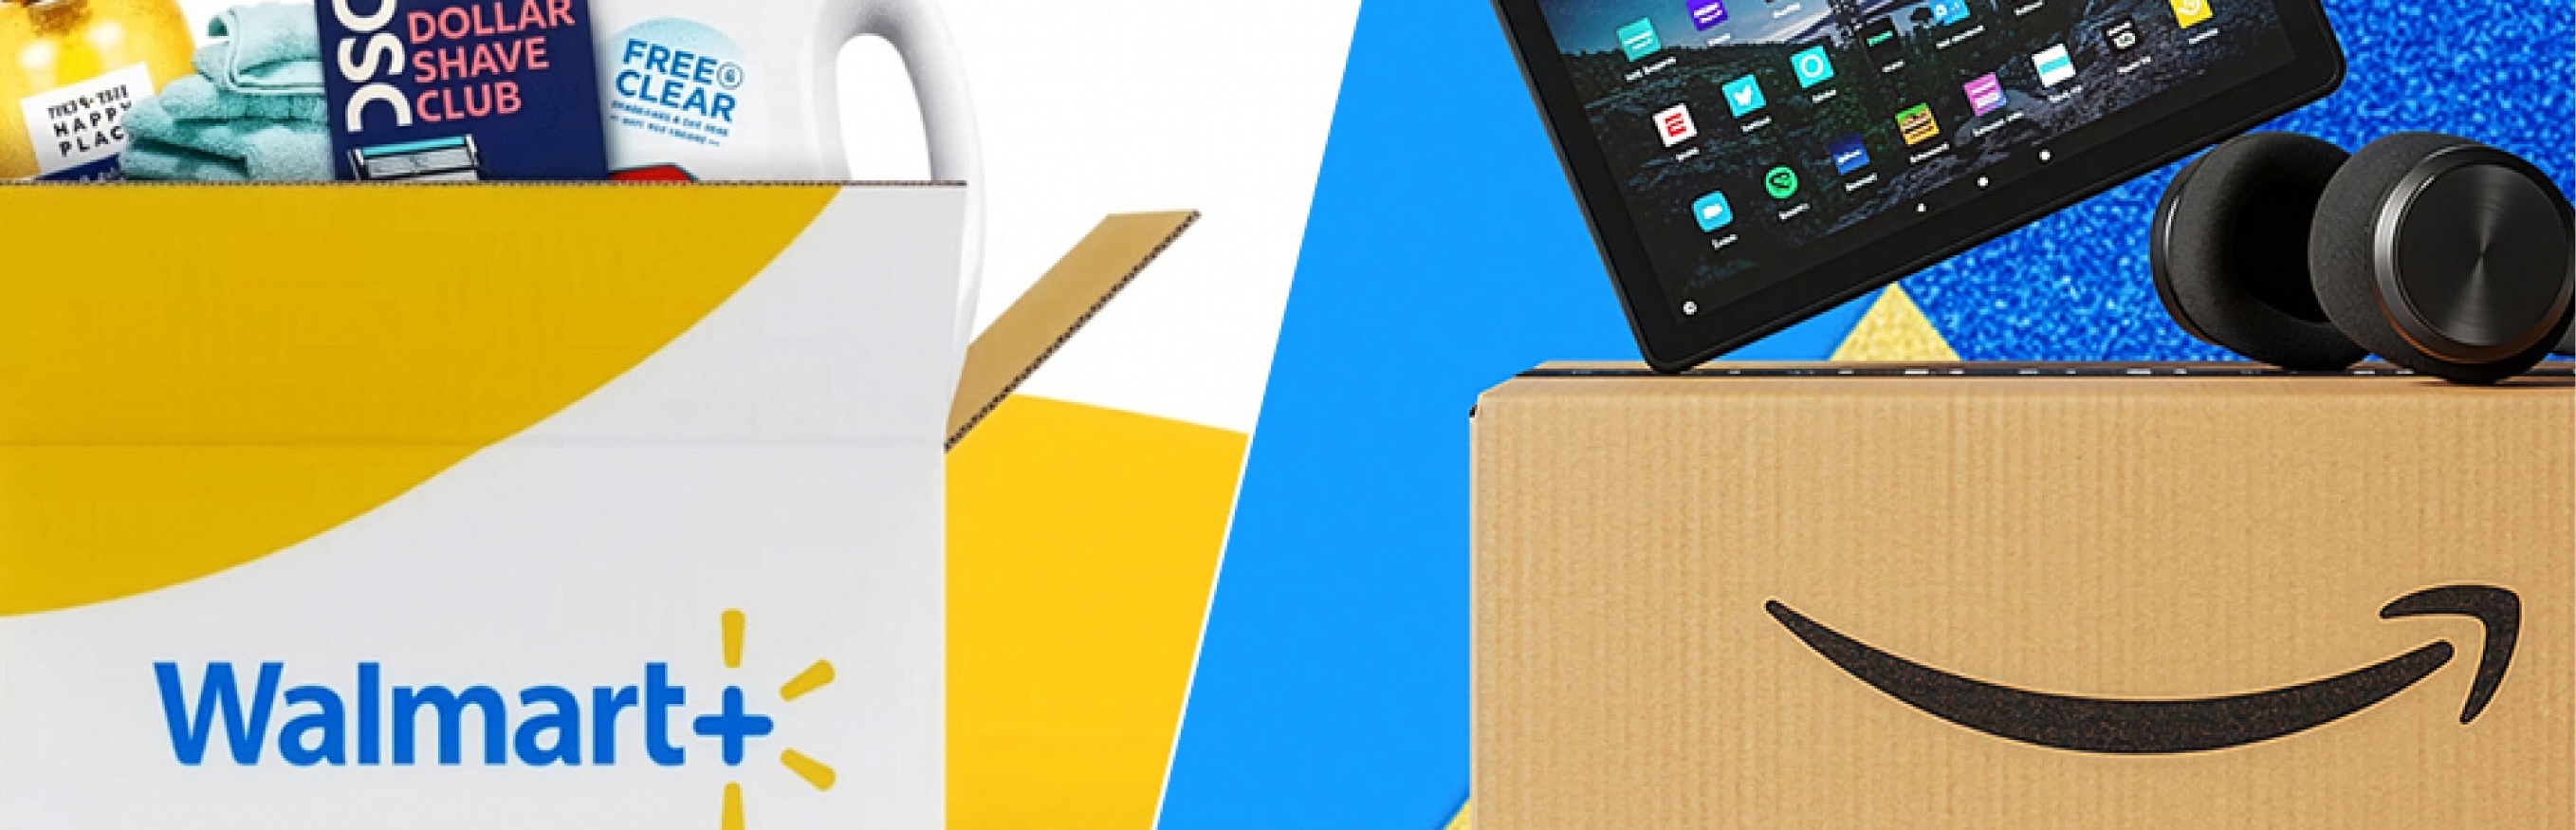
Header image for the June 2026 edition of the Amazon vs. Walmart Share of Wallet Report. PYMNTS Intelligence reports that Walmart wins the weekly trip, but Amazon is increasingly capturing the higher-margin retail spending basket.

Get Unlimited Access
Complete the form below for free, unlimited access to all our Data Studies, Trackers, and PYMNTS Intelligence reports.

Thank you for registering. Please confirm your email to view all our Trackers.

    yesSubscribe to our daily newsletter, PYMNTS Today.

    By completing this form, you agree to receive marketing communications from PYMNTS and to the sharing of your information with our sponsor, if applicable, in accordance with our Privacy Policy and Terms and Conditions.

    Walmart wins the trip. Amazon wins the basket. It’s an equation gaining urgency as the retail behemoths compete for precious and fragile consumer spending. Walmart pulls tens of millions of people through its doors every week for the fridge-replenishment run, anchored by groceries. The conventional logic is that the grocery trip should carry the rest of the cart along with it. The consumer is already in the store. They can touch and feel the shirt, test the bike, weigh the cookware and drop any of it in the same basket as the milk. That’s the advantage eCommerce spent two decades and billions of dollars trying to replicate. Walmart has it for free, every week.

    And yet Walmart is losing the broader cart.

    The data beneath Walmart’s flat retail share compared to rival Amazon shows two businesses moving in opposite directions. One is the trip, and Walmart owns it. The other is the considered order, the things people decide they want and have shipped. Amazon owns that by a widening margin. The interesting part isn’t that Amazon is winning the order. It’s that the in-person trip, which should be Walmart’s launch pad into the online order, has stopped springing.

    The trip belongs to Walmart

    Start with the number that looks like a problem but is actually a fortress. Walmart’s share of total U.S. retail spending has sat inside a narrow band, roughly 7.2% to 7.8%, for seven straight years. Read as a growth story, that’s stagnation and a wall around the weekly run.

    Groceries are the purest expression of that run. They are heavy, perishable and usually better fetched than shipped. Fresh food doesn’t stockpile, travel cheaply or wait, so the store is usually the better source for it. That’s why Walmart’s hold is both large and durable.

    The size of the hold is striking. In Q1 2026, Walmart led Amazon by nearly 18 percentage points of category share in food and beverage. That’s the category Amazon is struggling most to enter. Amazon added just 0.2 percentage points of share in food and beverage over the year, its slowest gain anywhere, against more than a full point in categories like sporting and hobby goods, books, and music. Walmart’s moat is obvious.

    The basket is the considered order, and Amazon owns it

    The other half of retail spending behaves nothing like the grocery run. It’s furniture the consumer decides to replace, the laptop they research, the jacket they finally buy or the bike they wanted to snatch up for their kid. These considered orders ship well, don’t need to happen today and don’t require a trip to the store. They are, in other words, built for Amazon, and the share data says Amazon has taken them.

    Across all retail, Amazon now holds about 19% more share than Walmart, 9.3% against 7.8%. This is the widest that distance has been recorded in a first quarter since Amazon first passed Walmart in 2024.

    Amazon now leads significantly in four of the seven retail categories. In sporting and hobby goods, music, and books, it leads Walmart by nearly 28 percentage points. For electronics and appliances, it dominates by 24 percentage points. In furniture and home, by 13 percentage points. In clothing and apparel, by 11 percentage points. These are precisely the goods that travel well in a box, delivered the same day or the next in most cases. Amazon wins them all without owning a single aisle of shelf space.

    It’s worth being fair to the obvious counterpoint here, which is that Amazon is simply the better eCommerce operator. The quarter supports that thesis. Amazon reached 9.28% of U.S. retail spending in Q1 2026, a record for any first quarter. That’s 8.1% growth in its retail share year over year, after a 2025 that saw its share grow by less than 1%. Amazon also gave back less share coming out of the holiday than it did a year earlier. Still, none of that explains why Walmart’s one structural weapon, the in-person trip, isn’t firing.

    The inversion: the trip should win the basket, and it doesn’t

    Here’s the puzzle: The oldest idea in mass retail is that you take a thin margin on groceries to drive the trip, and then you make the real money on the general merchandise people pick up while they are there. Grocery is the bait. The cart is the catch. Walmart is winning the bait and losing the catch.

    Picture the mechanics that the store model is supposed to guarantee. A shopper is in the store for the weekly food run. The clothing racks are thirty feet from the produce. The home section is on the way to the registers. The shopper can pick up a throw pillow, check the fabric, decide on the spot and walk out with it in the same basket as their groceries. Proximity and inspection are the two things a store is supposed to be unbeatable at, and Walmart has both, for free, on every visit.

    But the data shows it’s not converting. The shopper is making the run at Walmart and placing that considered order with Amazon—or simply not putting the item in the Walmart basket at all.

    In Q1 2026, Walmart held 10.35% of retail spending in the trip categories and just 5.87% in the considered order categories. Its trip share is about 76% higher than its order share, the widest that distance has ever been.

    The distance between Walmart’s two halves has grown more than five-fold since 2019. The same store, the same traffic, the same proximity, yet the order half keeps slipping while the trip half climbs. The lever is connected to nothing.

    Why it matters: the margin is in the half that Walmart is losing

    The backdrop makes the inversion expensive. Retail is shrinking inside the consumer wallet. It fell to 30.7% of U.S. personal consumption in Q1 2026, the lowest first-quarter share in the series, as healthcare and financial services take a growing share of the pocketbook. Within that smaller retail pie, the considered-order categories are growing as a share, reaching a fresh post-pandemic high as a share of retail.

    In other words, the half of retail that Walmart is losing is the half that’s growing. It’s also the half where the margin lives. The trip is the hardest part of retail to make money on. It’s high-volume, low-margin and logistically punishing, and Walmart is defending that piece well. The order is where the dollars are healthier, and that’s the half walking out the door to Amazon. Walmart’s position is a strong defense of a low-margin castle, while the high-margin territory is ceded to a competitor that never needed the castle in the first place.

    Which leaves the question that the next several quarters will answer. Walmart isn’t standing still. It has Walmart+, in-store and curbside pickup, a marketplace that keeps widening and the most valuable thing in retail: a reason for people to show up in person every week. It has OnePay, which offers financing for the goods that Walmart shoppers aren’t putting in their baskets. The question is whether any of that can reconnect the lever to non-grocery spending and whether the in-person trip can pull the basket again, the way the old model promised it would.

    Or whether the trip and the basket have become two different businesses, one that Walmart owns and one that Amazon does, sharing a parking lot and almost nothing else.

    About the data

    For the latest edition of the “Share of Wallet: Amazon vs. Walmart,” a PYMNTS Intelligence exclusive series, estimates are based on Amazon and Walmart quarterly earnings reports, the U.S. Census Bureau Monthly Retail Trade Survey and the U.S. Bureau of Economic Analysis Personal Consumption Expenditures series. Category share figures reflect each company’s share of U.S. consumer retail spending within a category for Q1 2026. Trip and order groupings are an editorial overlay on the report’s category data and describe how a good is purchased, not whether it is needed.

    About

    PYMNTS Intelligence is a leading global data and analytics platform that uses proprietary data and methods to provide actionable insights on what’s now and what’s next in payments, commerce and the digital economy. Its team of data scientists includes leading economists, econometricians, survey experts, financial analysts and marketing scientists with deep experience in the application of data to the issues that define the future of the digital transformation of the global economy. This multilingual team has conducted original data collection and analysis in more than three dozen global markets for some of the world’s leading publicly traded and privately held firms.

    We are interested in your feedback on this report. If you have questions or comments, or if you would like to subscribe to this report, please email us at feedback@pymnts.com.

    Disclaimer

    The Share of Wallet: Amazon vs. Walmart Series may be updated periodically. While reasonable efforts are made to keep the content accurate and up to date, PYMNTS MAKES NO REPRESENTATIONS OR WARRANTIES OF ANY KIND, EXPRESS OR IMPLIED, REGARDING THE CORRECTNESS, ACCURACY, COMPLETENESS, ADEQUACY, OR RELIABILITY OF OR THE USE OF OR RESULTS THAT MAY BE GENERATED FROM THE USE OF THE INFORMATION OR THAT THE CONTENT WILL SATISFY YOUR REQUIREMENTS OR EXPECTATIONS. THE CONTENT IS PROVIDED “AS IS” AND ON AN “AS AVAILABLE” BASIS. YOU EXPRESSLY AGREE THAT YOUR USE OF THE CONTENT IS AT YOUR SOLE RISK. PYMNTS SHALL HAVE NO LIABILITY FOR ANY INTERRUPTIONS IN THE CONTENT THAT IS PROVIDED AND DISCLAIMS ALL WARRANTIES WITH REGARD TO THE CONTENT, INCLUDING THE IMPLIED WARRANTIES OF MERCHANTABILITY AND FITNESS FOR A PARTICULAR PURPOSE, AND NONINFRINGEMENT AND TITLE. SOME JURISDICTIONS DO NOT ALLOW THE EXCLUSION OF CERTAIN WARRANTIES, AND, IN SUCH CASES, THE STATED EXCLUSIONS DO NOT APPLY. PYMNTS RESERVES THE RIGHT AND SHOULD NOT BE LIABLE SHOULD IT EXERCISE ITS RIGHT TO MODIFY, INTERRUPT, OR DISCONTINUE THE AVAILABILITY OF THE CONTENT OR ANY COMPONENT OF IT WITH OR WITHOUT NOTICE.
    PYMNTS SHALL NOT BE LIABLE FOR ANY DAMAGES WHATSOEVER, AND, IN PARTICULAR, SHALL NOT BE LIABLE FOR ANY SPECIAL, INDIRECT, CONSEQUENTIAL, OR INCIDENTAL DAMAGES, OR DAMAGES FOR LOST PROFITS, LOSS OF REVENUE, OR LOSS OF USE, ARISING OUT OF OR RELATED TO THE CONTENT, WHETHER SUCH DAMAGES ARISE IN CONTRACT, NEGLIGENCE, TORT, UNDER STATUTE, IN EQUITY, AT LAW, OR OTHERWISE, EVEN IF PYMNTS HAS BEEN ADVISED OF THE POSSIBILITY OF SUCH DAMAGES.
    SOME JURISDICTIONS DO NOT ALLOW FOR THE LIMITATION OR EXCLUSION OF LIABILITY FOR INCIDENTAL OR CONSEQUENTIAL DAMAGES, AND IN SUCH CASES, SOME OF THE ABOVE LIMITATIONS DO NOT APPLY. THE ABOVE DISCLAIMERS AND LIMITATIONS ARE PROVIDED BY PYMNTS AND ITS PARENTS, AFFILIATED AND RELATED COMPANIES, CONTRACTORS, AND SPONSORS, AND EACH OF ITS RESPECTIVE DIRECTORS, OFFICERS, MEMBERS, EMPLOYEES, AGENTS, CONTENT COMPONENT PROVIDERS, LICENSORS, AND ADVISERS.
    Components of the content original to and the compilation produced by PYMNTS is the property of PYMNTS and cannot be reproduced without its prior written permission.