

Finland did it again. The World Happiness Report (WHR) came out in March. For the seventh straight year, it was No. 1. Keeping the top spot on a “best” list for seven years running is no mean accomplishment. Lionel Messi got his seventh best player award in 2022, but that was over 14 years. The Finns are so happy, apparently, that they aren’t fazed by their 830-mile border with Russia. Not that the Putin regime would ever invade a neighboring country or anything.

We all enjoy lists that rank people, places, things and anything. Richest, best dressed, top restaurants, smartest dogs, best university, and just about anything anyone can rank. Some of these are frivolous, like most handsome men; others may be useful, such as the sunniest cities to visit in June; and some are so important they lead to fights and lawsuits, such as the best universities.
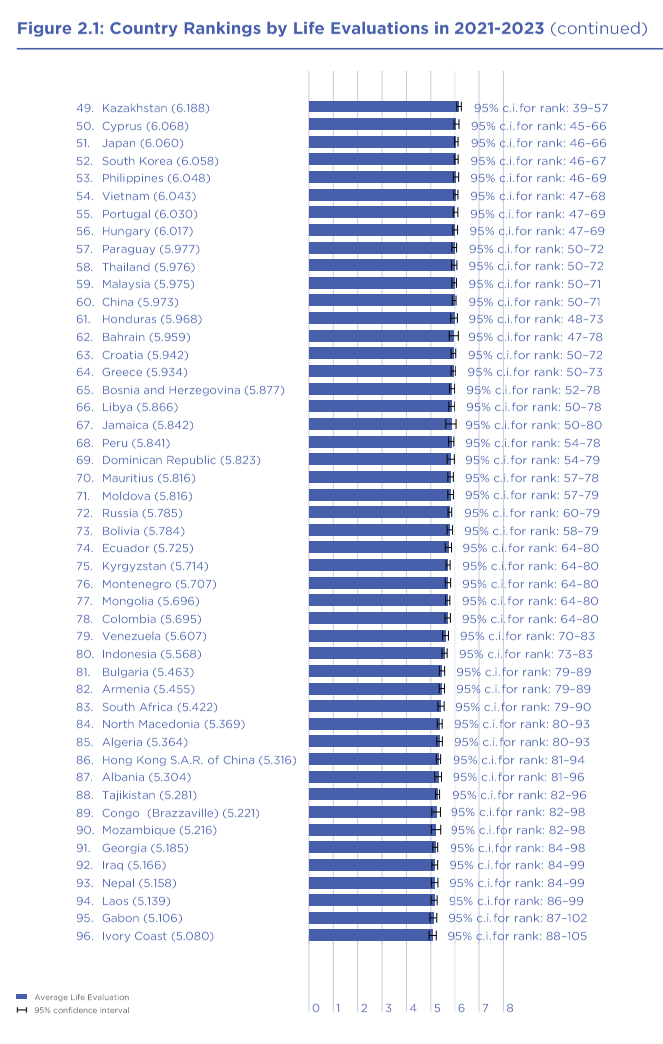
As an individual, you can’t really do much with the happiest country list. The Finns may be smiling, but that doesn’t mean an American would be happier if they moved to Finland. Portugal, in spot number 55, is becoming a popular destination for American retirees. Maybe they are happier living in a sunny place with a relatively low cost of living. We can always learn from social and economic policies in other countries. But that doesn’t mean the French would become happier if France became more like Finland.
In fact, a closer look at the World Happiness Report, which is perhaps the most rigorous annual happiness study reported by the media, shows that these rankings need to be used with care — if at all. The WHR is based on a Gallup Survey using a standard questionnaire for most countries. The 2024 results are based on an average of 2021-2023. The survey and analysis were done in concert with the United Nations and other serious institutions. And there are several high-powered economists associated with it. I’ll say more on the methodology in a bit.
An inspection of the list reveals an important insight. Not really. If you want to be happy, be born and live in a very small country. The top five countries in the WHR were Finland, Denmark, Iceland, Sweden and Israel. The average population of those countries was 6.6 million, a little bit smaller than my home state, Massachusetts. The smallest was Iceland, with 382,000 people and the largest was Sweden, with 10.5 million. The average for the top 10 was 9 million people; the top 10 includes the Netherlands, with 17.7 million people, and Australia, with 26 million. Six of the countries are small, homogenous and well-off.
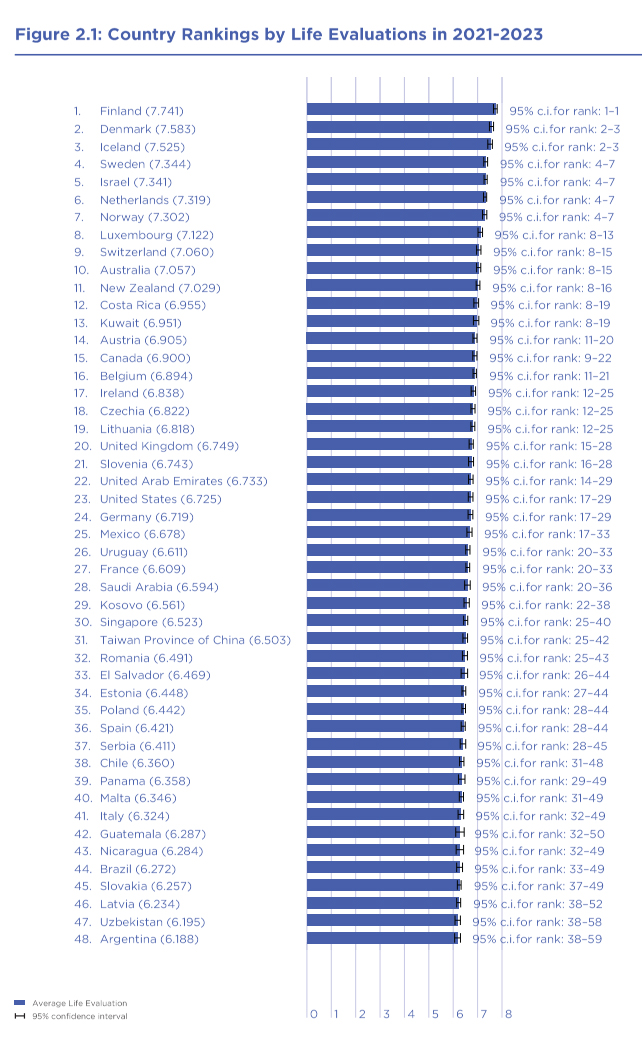
The big news in the WHR 2024 survey was that the U.S. got bounced out of the top 20 happiest countries. Sadly, the U.S. plummeted from 15 to 23.
The U.S., with 333 million people, dropped eight places partly because it was overtaken by a few very small countries: Belgium, Chezia, Costa Rica, Kuwait, Lithuania, Slovenia and UAE. Their average population was 6.1 million, with a range from 2.1 million to 11.7 million. These seven countries had a total population of 36.6 million, slightly less than California and about 11 percent of the U.S. population. The eighth country that nudged out the U.S. was the U.K., but we’ll see below that was a dead statistical heat.
Speaking of small, the difference in the score for 16th-ranked Belgium (6.894) and 23rd-ranked U.S. (6.725) seems too tiny to mean anything unless we’re talking about the fastest times in seconds for the 50-meter sprint.
Combining larger regions similar in size and diversity to the U.S. reveals very different results. This matters in policy debates where commentators talk about how Europeans are happier than Americans. The big five European economies — Germany, the U.K., France, Italy, Spain and the Netherlands (the pre-Brexit EU-5) have about 325 million people, so similar to the U.S. The average happiness score was 6.59, lower than the US 6.72. Europe (the E.U. plus the U.K., Norway, and Switzerland) has 529 million people and a rank of 6.61. So, keeping with this game, the U.S. is happier than the EU-5 and Europe. But only if those small differences meant anything.
In fact, these differences in rankings don’t mean anything, statistically speaking.
Gallup surveys roughly 1,000 people in every country — the same number, whether it’s Luxembourg or China. They then pool the sample over three years, giving them roughly 3,000 people per country. Those might not be bad sample sizes if we were asking people whether they were happy or not and were just making comparisons between two countries. However, the Gallup survey asks people to say where they are on a 10-point scale. It then takes the average of people in those countries and makes statements about whether one country is happier than another.
Not surprisingly, the margins of error are enormous for this application. The WHR reports these (see the figure above). Take the U.S. at rank 23. The 95 percent confidence interval is 17-29. That’s a full 12 spots. The U.S. is not statistically different than Ireland at 17 or Kosovo at 29. The confidence interval for the U.K. is 15-28, which means there is no statistically significant difference between the U.K.’s rank of 20 with a score of 6.749 and the U.S.’s rank of 23 with a score of 6.725. And it is no surprise that the popular media goes with the exciting ranks and ignores the boring margins. The U.S., EU-5, and Europe averages are almost certainly statistically the same. (The other reason to discount small differences is that there could be measurement errors resulting from the possibility that the survey question itself does not provide an accurate measure of true happiness. Given how small the differences are, it wouldn’t take much error to reverse the rankings.)
The small samples may also mean that the survey does not do a good job of picking up pockets of great happiness and deep unhappiness across a country. It is probably fine for small, homogenous countries like Norway. For the U.S., a three-year sample of 3,000 works out to about 60 people per state and less for different communities in those states.
There’s a more serious problem with the rankings. They may be simply wrong.
Gallup asks “respondents to think of a ladder, with the best possible life for them being a 10 and the worst possible life being a zero. They are then asked to rate their own current lives on that 0-10 scale.” Gallup takes a population-weighted average of the responses on that scale to get the average for a country.
Converting those rank orders (my nine is better than your one) into continuous numbers (6.725 for the U.S. vs. 6.719 for Germany) is not straightforward. To begin with, we don’t know that happiness is increasing the same between steps; going from 2-3 is not necessarily the same as going from 7-8. We also don’t know within steps where people in different countries are — maybe in one country people are closer to the next highest step and in the other they are closer to the next lowest step. In “The Sad Truth About Happiness Scales,” economists Timothy Bond and Kevin Lang (go here for a short, non-technical summary), show that it is almost impossible to come up with a reliable way of solving this problem. It is easy to use the same happiness data to come up with completely different rankings depending on what the analyst assumes about the unknown distribution of happiness within and across countries.
David Blanchflower and Alex Bryson, two of the leading and careful economists studying happiness, looked at how U.S. states rank compared to each other and other countries. They use the same data as the WHR outside of the U.S. In the U.S. they were able to use the Gallup US Daily Tracker files which asked similar questions and gave them vastly more respondents. They combined the data for 2008-2017, with about 1.9 million observations outside the U.S. and 3.5 million in it. Instead of using just the life satisfaction measure, as the WHR did, they use several measures of positive aspects of happiness (such as, did you enjoy your day yesterday) and negative aspects (such as, were you in pain yesterday).
U.S. states captured nine of the top 10 places and 16 of the top 20. Of course, you want to see the list. The winner — here’s a shocker — is Hawaii. That’s followed by Minnesota (it does have the highest population of people with Finnish descent). Then there are the Dakotas, Iowa, Nebraska, Kansas, Alaska and Wisconsin. I’m watching the fourth season of “True Detective,” with Jodie Foster, which takes place in Alaska. No one looks very happy and it is dark and snowy. As it turns out, these are all very small states. Hawaii only has 1.4 million people.

So once again, if you’re happy, and you know it, you must be living in a small country or a small state. If I moved from Massachusetts, which is ranked 55, to one of the top 10, I would be in a happier place. South Dakota would get me to fourth place. It has no income tax, and they have buffalos.
I think I’ll stay put.
Dr. David S. Evans is an economist who has published more than 10 books and 200 articles, many related to entrepreneurship, platforms, and the digital economy. He is Chairman, Market Platform Dynamics and Managing Director, Berkeley Research Group. He has taught at the University College London and the University of Chicago Law School. For more details see davidsevans.org.


We’re always on the lookout for opportunities to partner with innovators and disruptors.
Learn More