
September 2026
Share of Wallet: Amazon vs. Walmart

Amazon Takes Five Categories as Walmart Tightens Its Grocery Grip

Amazon has widened its lead over Walmart and now captures more consumer spending in five of the seven retail categories tracked by PYMNTS Intelligence. Yet Walmart’s grocery advantage is growing, giving the retailer a powerful connection to the weekly store trip that Amazon has barely dented. This report reveals where each company is gaining ground and what their growing divide signals for the future of retail.

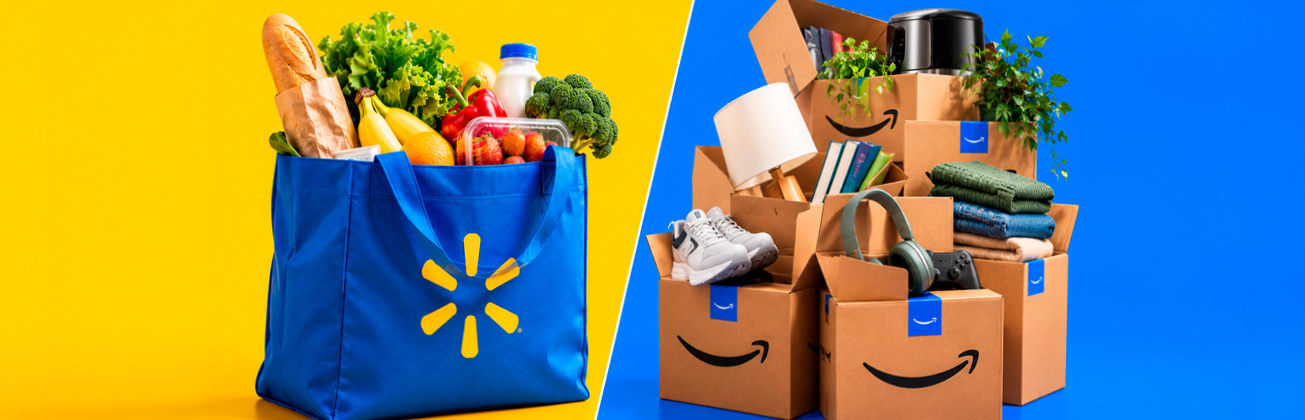
Header image for the September 2026 edition of the PYMNTS Intelligence Share of Wallet: Amazon vs. Walmart report. PYMNTS Intelligence examines how Amazon leads consumer retail spending across five categories while Walmart strengthens its grip on grocery.

Shopping can take different forms. It can mean going to the store to fill up a cart with urgently needed items that don’t require deliberation, like paper towels and pantry staples. Or it can refer to sitting on the couch with a cell phone or laptop, researching sofas online over days or weeks (perhaps by asking an AI chatbot) and eventually clicking the buy button for delivery. That distinction is shaping the battle between eCommerce giant Amazon and physical store behemoth Walmart for consumer retail spending.

In Q2 2026, Amazon reached its highest ever share of U.S. retail spending, 9.59%, while Walmart’s total share slipped to 7.50%. Amazon’s lead is its largest ever, and the retail behemoth is winning in five out of the seven tracked retail categories, often by a wide margin. Meanwhile, Walmart’s share of grocery spending rose to a high of 21.0%, while Amazon only captured 3.0%. Amazon is growing its food and beverages business, but at this rate, it will take the company a long time to close the gap. In effect, Amazon is winning the order, while Walmart still captures the trip.
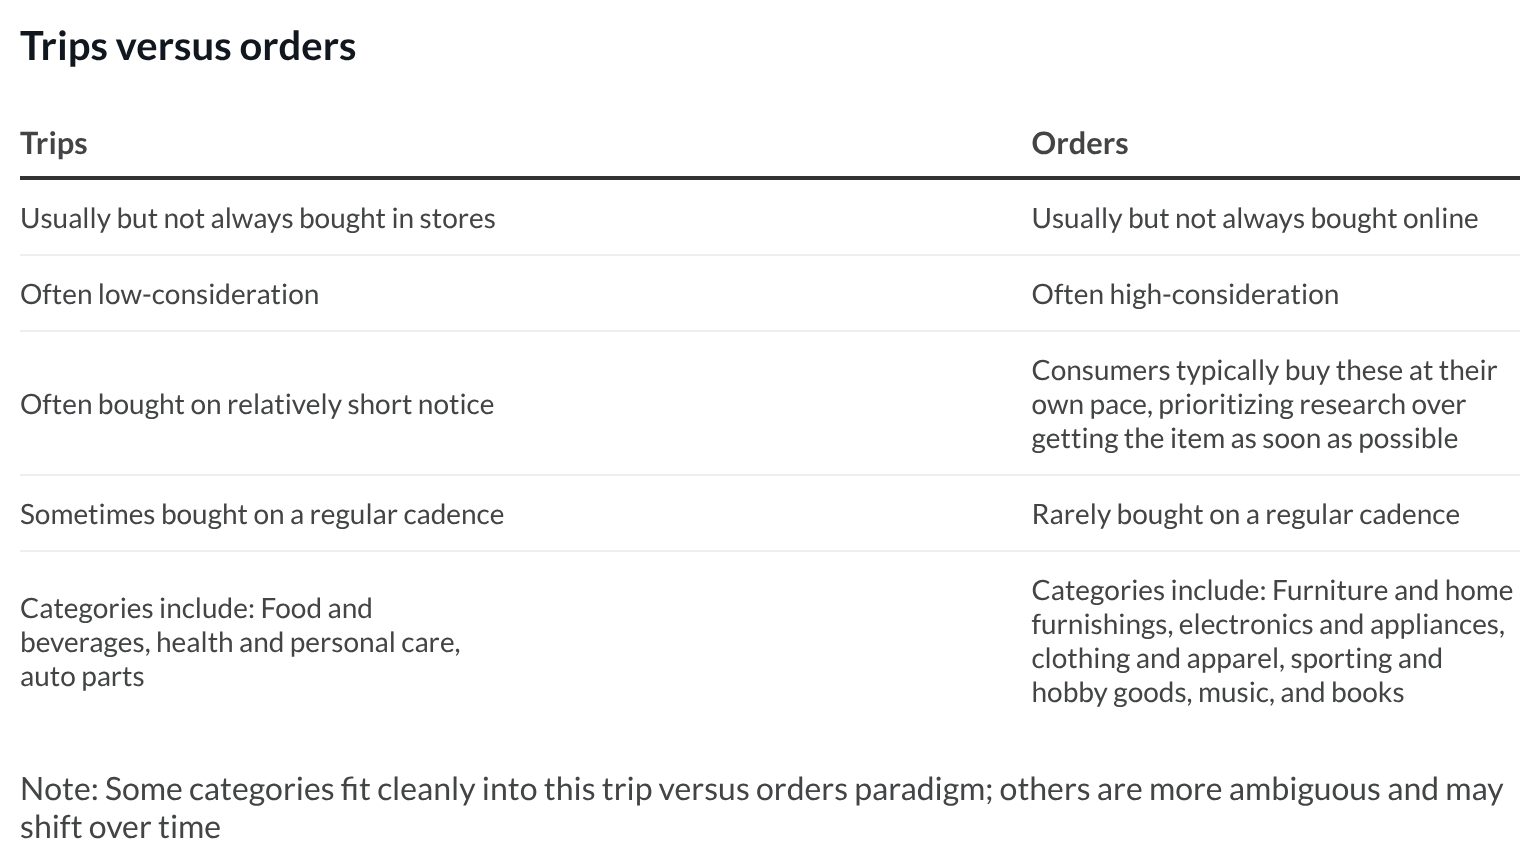
Chart explaining Trips and Orders

These are among the findings from the latest edition of the Share of Wallet: Amazon vs. Walmart series from PYMNTS Intelligence, which tracks each company’s share of U.S. consumer retail spending using earnings reports alongside U.S. Census Bureau and U.S. Bureau of Economic Analysis data.

Amazon and Walmart increasingly look like two companies competing in two different markets: one where the store visit has become optional, and one where it hasn’t.

Get Unlimited Access
Complete the form below for free, unlimited access to all our Data Studies, Trackers, and PYMNTS Intelligence reports.

Thank you for registering. Please confirm your email to view all our Trackers.

    Subscribe to our daily newsletter, PYMNTS Today.

    By completing this form, you agree to receive marketing communications from PYMNTS and to the sharing of your information with our sponsor, if applicable, in accordance with our Privacy Policy and Terms and Conditions.

    Consumer retail spending finally leveled out, while ‘order’ categories continued to gain share.

    For four straight years, retail’s share of consumer spending was shrinking. It peaked at 34.7% in the second quarter of 2021, at the tail end of pandemic-era shopping, then slid to 31.1% by 2025, a drop of roughly 10%. From April through June 2026, those declines leveled out, with purchases in the order category ticking up slightly to 24%.

    Beneath those headline numbers, the kinds of retail purchases that consumers make are shifting. They’re relying less on trips to physical stores and more on online orders. Order categories’ share of the retail market reached a new high in Q2 2026. It hit 24.0% of retail spending, up from 21.1% in 2019. In general, there’s been a gradual shift toward purchases people plan for and usually have delivered rather than pick up on the way home from work.

    This shift affects Amazon and Walmart because the two retailers don’t compete evenly across the trip and order categories. Amazon’s eCommerce business obviously skews toward orders, and Walmart’s toward trips, so as order categories’ slice of consumer retail spending creeps upward, that spells good news for Amazon.

    Amazon gained the largest lead over Walmart yet.

    Amazon captured 9.59% of total U.S. retail spending in Q2 2026, a new high. Walmart, meanwhile, fell to 7.50%, down from 7.72% a year earlier, its first Q2 decline in two years. The gap between them (i.e., Amazon’s share minus Walmart’s) widened to 2.09 percentage points, which is roughly double the 1.05 percentage point gap recorded a year earlier. Amazon now captures roughly 28% more consumer retail spending than Walmart, a complete reversal from 2019, when Walmart’s 7.34% share was nearly double Amazon’s 4.24%.

    It’s not all doom and gloom for Walmart, though. While the company’s overall retail share fell, its share of food and beverages spending rose 0.31 percentage points over the same stretch to a Q2 high of 20.97%. In short, Walmart’s slide is concentrated in the categories where Amazon was already ahead, not spread across its whole business.

    Amazon is now winning in five of the seven categories that comprise consumer retail spending.

    While Walmart may be retaining strength in grocery, Amazon leads in most consumer spending categories. The company gained share year over year in all seven retail categories tracked, and it now leads Walmart in five of them: every order category, plus health and personal care (one of those categories close to the line between trip and order). In the latter category, Amazon’s lead gained 0.44 percentage points year over year.

    The categories where Amazon has the largest lead are hardly surprising: sporting and hobby goods, music, and books (+29.8 percentage points); electronics and appliances (+26.8); furniture and home furnishings (+14.3) and clothing and apparel (+11.8).

    In grocery, Walmart has a wide 18.0 percentage point lead. The only other category where Walmart is winning is auto parts (+3.3). These are both trip categories, the kind of purchase that still usually sends someone to a physical location.

    The retail market has changed a lot since 2019. Four categories have shifted at least 12 percentage points toward Amazon: sporting and hobby goods, music, and books (+18.5 percentage points), furniture and home furnishings (+15.8), electronics and appliances (+14.2) and clothing and apparel (+11.8). (Sums of individual items may not equal totals due to rounding.)

    Health and personal care and auto parts rose too. Food and beverages, however, barely budged. Amazon’s own share of the category grew, but Walmart’s grew faster, widening the gap from a 16.6 percentage point lead for Walmart in 2019 to an 18.0 point lead in 2026, a change of just 1.4 percentage points. Grocery looks to be the most stable category and the one most anchored to an actual trip to the store.

    At this rate, it would take Amazon almost 100 years to close Walmart’s grocery lead.

    That stability is what keeps Walmart in the fight. The food and beverages category makes up roughly 60% of Walmart’s retail business, a share that has held steady since 2019. Moreover, Walmart’s share of overall consumer spending in the category climbed to 21.0% in 2026, up from 18.4% seven years earlier, a Q2 high. Grocery is keeping Walmart relevant in shoppers’ lives, bringing them through the door every week, where they often pick up other items along the way.

    Amazon is chipping away at the category, but very slowly. Its share of food and beverage spending grew from 1.78% in 2019 to 2.95% in 2026, a roughly 1.7-fold increase. Still, the gap between the two companies widened slightly in absolute terms, from 16.6 percentage points to 18.0 percentage points. At its current seven-year pace, Amazon would need close to a century to match Walmart’s current share of the grocery aisle.

    In general, Amazon and Walmart are increasing their strengths in the categories where they do best, rather than fighting over the same ground. Amazon keeps winning in areas where the store trip has become optional. Walmart has held its footing and even made gains in its grocery stronghold, where most consumers still choose brick-and-mortar.

    Read More

    PYMNTS Intelligence is the leading provider of information on the consumer trends driving innovation in consumer finance, digital payments and financial inclusion. To stay up to date, subscribe to our newsletters and read our in-depth reports.

    Methodology

    Shopping Showdown: Amazon Wins Orders While Walmart Wins Trips,” the September 2026 edition of the PYMNTS Intelligence Share of Wallet: Amazon vs. Walmart series, examines each company’s share of U.S. retail spending as of Q2 2026. The estimates draw on PYMNTS Intelligence’s analysis of Amazon and Walmart quarterly earnings reports, combined with the U.S. Census Bureau’s Monthly Retail Trade Survey and Personal Consumption Expenditures data from the U.S. Bureau of Economic Analysis.

    Trip categories (food and beverage, health and personal care, auto parts) are goods people typically buy in person on a regular store run—where perishability, urgency, size or immediate need make physical presence useful. Order categories (furniture and home goods, electronics and appliances, clothing and apparel, sporting goods/hobby goods/music/books) are goods that don’t require a store trip. Consumer behavior within order categories varies—from deeply researched purchases like electronics to routine reorders like household staples—but the common feature is that the trip is optional.

    About

    PYMNTS Intelligence is a leading global data and analytics platform that uses proprietary data and methods to provide actionable insights on what’s now and what’s next in payments, commerce and the digital economy. Its team of data scientists includes leading economists, econometricians, survey experts, financial analysts and marketing scientists with deep experience in the application of data to the issues that define the future of the digital transformation of the global economy. This multilingual team has conducted original data collection and analysis in more than three dozen global markets for some of the world’s leading publicly traded and privately held firms.

    The PYMNTs Intelligence team that produced this report:
    Ignacio Marquez: Research Analyst
    Carson Olshansky: Senior Writer

    We are interested in your feedback on this report. If you have questions or comments, or if you would like to subscribe to this report, please email us at feedback@pymnts.com.

    Disclaimer

    The Share of Wallet: Amazon vs. Walmart Series may be updated periodically. While reasonable efforts are made to keep the content accurate and up to date, PYMNTS MAKES NO REPRESENTATIONS OR WARRANTIES OF ANY KIND, EXPRESS OR IMPLIED, REGARDING THE CORRECTNESS, ACCURACY, COMPLETENESS, ADEQUACY, OR RELIABILITY OF OR THE USE OF OR RESULTS THAT MAY BE GENERATED FROM THE USE OF THE INFORMATION OR THAT THE CONTENT WILL SATISFY YOUR REQUIREMENTS OR EXPECTATIONS. THE CONTENT IS PROVIDED “AS IS” AND ON AN “AS AVAILABLE” BASIS. YOU EXPRESSLY AGREE THAT YOUR USE OF THE CONTENT IS AT YOUR SOLE RISK. PYMNTS SHALL HAVE NO LIABILITY FOR ANY INTERRUPTIONS IN THE CONTENT THAT IS PROVIDED AND DISCLAIMS ALL WARRANTIES WITH REGARD TO THE CONTENT, INCLUDING THE IMPLIED WARRANTIES OF MERCHANTABILITY AND FITNESS FOR A PARTICULAR PURPOSE, AND NONINFRINGEMENT AND TITLE. SOME JURISDICTIONS DO NOT ALLOW THE EXCLUSION OF CERTAIN WARRANTIES, AND, IN SUCH CASES, THE STATED EXCLUSIONS DO NOT APPLY. PYMNTS RESERVES THE RIGHT AND SHOULD NOT BE LIABLE SHOULD IT EXERCISE ITS RIGHT TO MODIFY, INTERRUPT, OR DISCONTINUE THE AVAILABILITY OF THE CONTENT OR ANY COMPONENT OF IT WITH OR WITHOUT NOTICE.
    PYMNTS SHALL NOT BE LIABLE FOR ANY DAMAGES WHATSOEVER, AND, IN PARTICULAR, SHALL NOT BE LIABLE FOR ANY SPECIAL, INDIRECT, CONSEQUENTIAL, OR INCIDENTAL DAMAGES, OR DAMAGES FOR LOST PROFITS, LOSS OF REVENUE, OR LOSS OF USE, ARISING OUT OF OR RELATED TO THE CONTENT, WHETHER SUCH DAMAGES ARISE IN CONTRACT, NEGLIGENCE, TORT, UNDER STATUTE, IN EQUITY, AT LAW, OR OTHERWISE, EVEN IF PYMNTS HAS BEEN ADVISED OF THE POSSIBILITY OF SUCH DAMAGES.
    SOME JURISDICTIONS DO NOT ALLOW FOR THE LIMITATION OR EXCLUSION OF LIABILITY FOR INCIDENTAL OR CONSEQUENTIAL DAMAGES, AND IN SUCH CASES, SOME OF THE ABOVE LIMITATIONS DO NOT APPLY. THE ABOVE DISCLAIMERS AND LIMITATIONS ARE PROVIDED BY PYMNTS AND ITS PARENTS, AFFILIATED AND RELATED COMPANIES, CONTRACTORS, AND SPONSORS, AND EACH OF ITS RESPECTIVE DIRECTORS, OFFICERS, MEMBERS, EMPLOYEES, AGENTS, CONTENT COMPONENT PROVIDERS, LICENSORS, AND ADVISERS.
    Components of the content original to and the compilation produced by PYMNTS are the property of PYMNTS and cannot be reproduced without its prior written permission.