There’s a crisis in customer satisfaction, and brands that get it are likely to come out on top.
The Wall Street Journal (WSJ)reported Tuesday (March 7) on results of the latest National Customer Rage Survey conducted periodically by Customer Care Measurement & Consulting and the W.P. Carey School of Business at Arizona State University.
In short, customers are angrier now than they were in 2020, the last time the study was done, and when a customer thinks their complaint is ignored or poorly handled, it triggers a “revenge” response which typically sends that consumer to another merchant or brand.
“The percentage of consumers who have taken action to settle a score against a company through measures such as pestering or public shaming in person or online has tripled to 9% from 3% in 2020, according to the study,” WSJ reported. “That reversed a downward trend with regards to revenge-seeking behavior: The average percentage of customers seeking revenge between 2003 and 2017 was 17%.”
Scott Broetzmann, president and CEO of Customer Care Measurement & Consulting told WSJ: “It’s the idea of, if you as a company don’t really seem to care, well then I’m going to take to the streets.”
More frustration and subsequent social media shaming of brands come after a year of high inflation that forced trade downs in many areas of consumer life, so the purchases people did make in the past 12 months were more considered, which brings higher expectations.
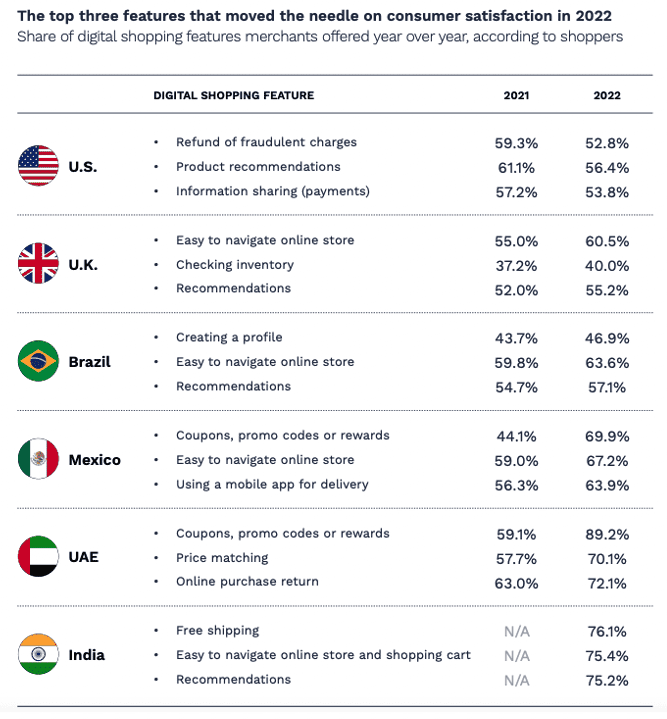
PYMNTS research confirms the correlation. In the 2023 Global Digital Shopping Index (GDSI), a PYMNTS and Cybersource collaboration based on surveys of over 13,000 consumers and 3,000 merchants in six nations, the way customer dissatisfaction is handled — be it returns or disputed charges — can either fix a misstep or alienate customers and lead to lost business.
For example, U.S. merchants saw their GDSI score drop by 4%, with most of that loss pegged to consumer unhappiness over how their complaints were addressed — or not — by merchants. The GDSI focused less on things like call center complaints and more on payments-related issues and the services they expect merchants to provide for free and without friction.
“The study shows that the features that offer product certainty and ease of access are highly correlated to reducing friction and improving overall customer satisfaction,” the GDSI stated.
For example, free returns, easy dispute resolutions, and clear product details are among the most desired features across all studied countries in the GDSI.
“This goes to show that although consumers in every country have their own unique shopping preferences, certainty, ease of use and smooth shopping experiences have a universal appeal,” the study found.
The GDSI added that “shopper satisfaction increases when merchants add and make consumers aware of features they consider valuable to their shopping experiences, and shopper satisfaction decreases when merchants remove or change features consumers find valuable.”
The new National Customer Rage Survey, based on a survey sample of 1,000 consumers, noted that “complainants creating social media posts about their most serious problem has more than doubled, [and] 32% of complainants posted information about their most serious problem on social media sites — more than double those posting in 2020.”
With 43% of respondents to the “Rage” survey saying they “lost money” due to a product or service problem — up six percentage points from 2020 — it’s clear that money figures prominently in consumer dissatisfaction, and PYMNTS found a similar connection.
“Free shipping, free returns, and guaranteed refunds for fraudulent charges are highly correlated to the 4% decline in the U.S. GDSI score,” PYMNTS’ GDSI study found. “Many U.S. merchants stopped offering guaranteed refund policies this year,” and the pullback in those services helps explain heightened levels of consumer anger with brands over the past year.