
The year 2022 marked a continued emergence from the pandemic, and new data show just how much — and how fast — we spent our take home pay to keep things going.
The Bureau of Labor Statistics (BLS) reported Friday (Sept. 8) that average annual expenditures for all consumers came in a $72,967 last year, up 9% from 2021. But the average income, before taxes, per the same report, grew by 7.5%.
Drilling down into the data, housing accounted for a full third of spending, trailed by transportation at roughly 17% and by food, which accounted for 12.8% of spending.
The government data also show that the biggest year-on-year increases in household spending came through food, up 12.7%, and then a 12.3% increase in spending on personal care products.
The increase in spending on food, the BLS said, was driven by food away from home, as spending in that category was up 20.1%, accompanied by an increase in food at home spending (read: groceries), which was up 8.4%.
Spending on apparel and services increased 10.9% in 2022.
So: Shelter, food, clothing were dominant categories. We noted that the “housing” component of the BLS stats includes spending on “other” lodging, which includes trips — and, with a bit more granularity, the spending on owned dwellings was in the low teens of overall expenditures, and a lesser percentage for rent.
The BLS data dovetails with PYMNTS research from earlier in the year that shows that the annualized cost of shelter, food and clothing, in the aggregate — those everyday essentials — has grown 19.8% since before the pandemic, as measured through the end of last year. Our research detailed that that the cost of essentials as a share of disposable income comes to 22.4%. No matter how you slice it, the overall trend of keeping the household intact, functioning and fed — the roof over one’s head, the cupboard stocked — the trend has been up and to the right.
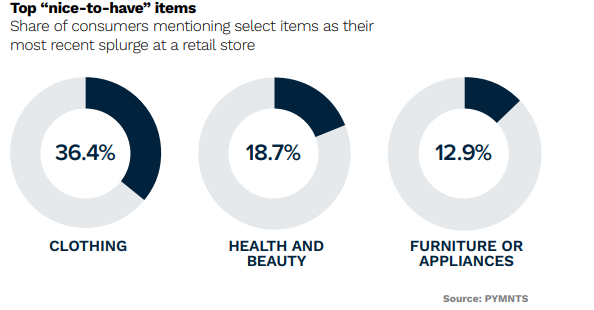
And that means, too, that American consumers’ savings cushion, as spending accelerates at a pave faster than income, bears at least some of the brunt of the impact. As we noted last month, peak savings, spurred by the pandemic, topped $2 trillion, but the cushion is due to run out this quarter, the Federal Reserve Bank of San Francisco said. In an age where 27% of households say they’ve used their savings to cover credit card debt alone, and where a record number of 401(k) plan holders dipped into those accounts to cover costs last year, the dry kindling to keep spending at such lofty levels is a bit less well-stocked than had been seen. Last week we documented that, as consumers spent some money on non-essential items, a few categories were top of mind, as seen in the accompanying chart. In the months ahead, when that urge to splurge sets in, the spirit may be willing, but the wallet may prove weak.

We’re always on the lookout for opportunities to partner with innovators and disruptors.
Learn More