Smaller banks and large financial institutions have been subject to a paradox where smaller banks are known to be more consumer-friendly, but the trade-off has been that they are slower to innovate than larger FIs.
The Innovation Readiness Playbook investigates how much truth is in this perception and seeks to answer the question of whether bigger budgets allow for more innovation.
Not necessarily. The study found that greater assets do not always translate into greater innovation and that a company’s culture plays a prominent role.
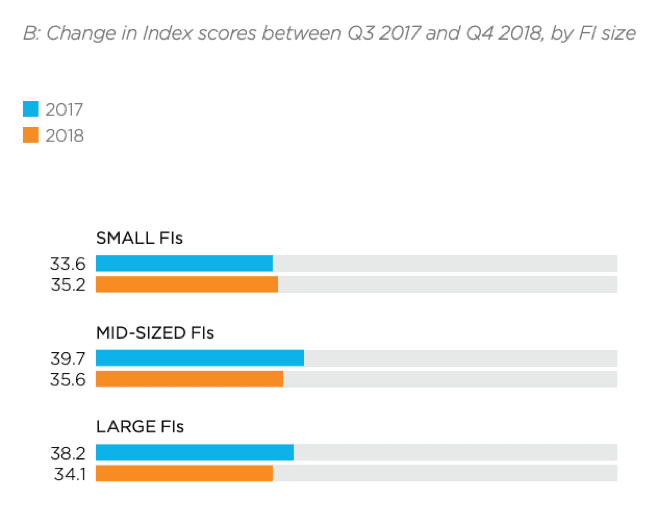
Banks with assets below $500 million have boosted their Index scores — from 33.6 in Q3 2017, the last time this survey was conducted, to 35.2 in Q4 2018 — while those of medium- and larger-sized FIs have declined.
For one thing, there are more small FIs now than in 2017 while the number of large FIs has decreased. Small FIs with assets below $500 million made up 23.5 percent of the sample in Q4 2018, up from 13 percent in 2017, while larger FIs with assets in excess of $25 billion made up 12.5 percent, a decrease from 22.8 percent.
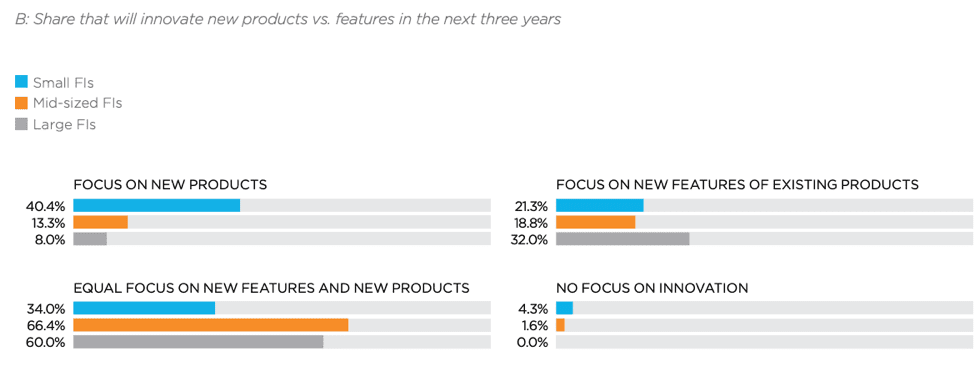
There are also differences between what innovation means to different sized FIs. Larger, more established FIs see innovation as building on past investments and products while smaller banks view innovation as new product lines. In the study, a much larger share of small FIs are focused on new products (40.4 percent) than mid-sized (13.3 percent) or large FIs (8.0 percent). Roughly one-third (32.0 percent) of large FIs are concentrating on new features for existing products while midsized FIs were the most likely to be focusing equally on new features and new products (66.4 percent).
For small FIs this means a near-future focus on UX (57.4 percent) and payment technology (55.3 percent). Midsized FIs (55.5 percent) and large FIs (68.0 percent) were more inclined to focus on payment technology. This is likely to do with small banks realizing that investing in new tech is pointless unless it is user-friendly.

One significant finding from the Innovation Readiness Playbook was that budgets don’t always correlate with innovation. Small FIs devote roughly one-third (33.2 percent) of their budget to innovation while large FIs spend 22.8 percent of their budget. Mid-sized FIs spend the largest share of budget on innovation (45.7 percent).
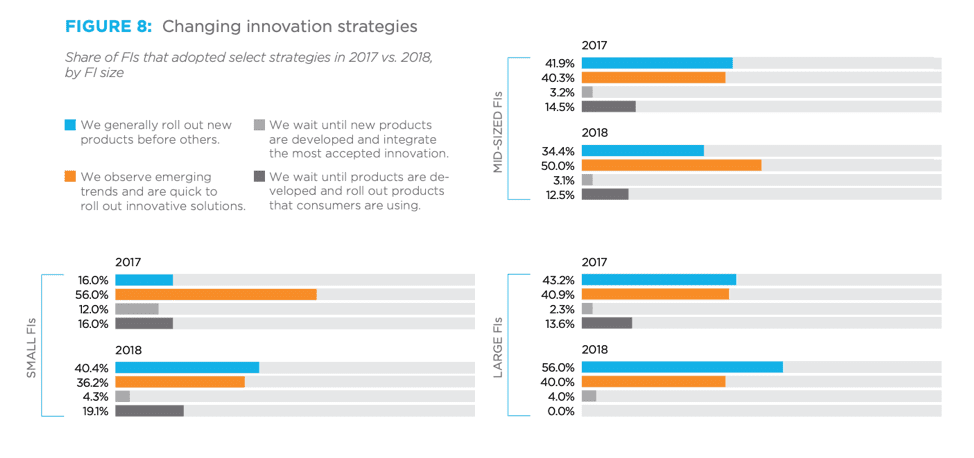
Regardless of investments, small FIs have grown more aggressive in their innovation strategies. The study shows 40.4 percent of them angled to be first to market in 2018, more than double the share that took this bold approach in 2017. More than half (56.0 percent) of large FIs also try to roll out new products before others, but that figure hasn’t changed radically since 2017. Half of mid-sized FIs observe trends first, then launch innovations.
Size is also playing less of a role in performance than it used to. Smaller FIs make up 20 percent of top performers, while larger ones comprise just 6.7 percent. The remaining 73.3 percent of top performers were midsized FIs, which isn’t surprising considering that midsized FIs comprised the majority of the firms surveyed.
What do high performers have in common? The study suggests success is related to funding, timeliness, managerial leadership and organizational structures. Looking at investments among high performers, 93.3 percent of that group devote more than 40 percent of their budgets to innovation. At the other extreme, just 31.3 percent of bottom performers designate the same share of their budgets to new products and features.
Top performers were also the most likely to say management was more important in facilitating innovation (60.0 percent) than organizational structure (40.0 percent).
Staying on schedule was also a performance indicator. Top performers report that they complete their innovations on schedule or early 100 percent of the time. This stands out from bottom performers, as just 18.8 percent of them report rolling out new features on time.
Staying on track doesn’t mean speed, though. Top-performing FIs take more time to roll out new features compared to others, with 46.7 percent of them requiring seven months or longer to release new products in Q4 2018. Meanwhile, 81.3 percent of bottom performers completed projects in less than six months.