The third quarter is newly in the rearview mirror. Earnings season still rolls on.
The FinTech IPO Index, which chronicles the stock market performance of nearly four dozen names that seek to disrupt and foment innovation in everything from mortgage lending to buy now, pay later (BNPL) to restaurant technology, is up about 20.7% year to date.
At this writing, headed into the second half of November, the Index is trailing the tech-heavy Nasdaq, a strong relative benchmark, which is up 30% over the same timeframe.
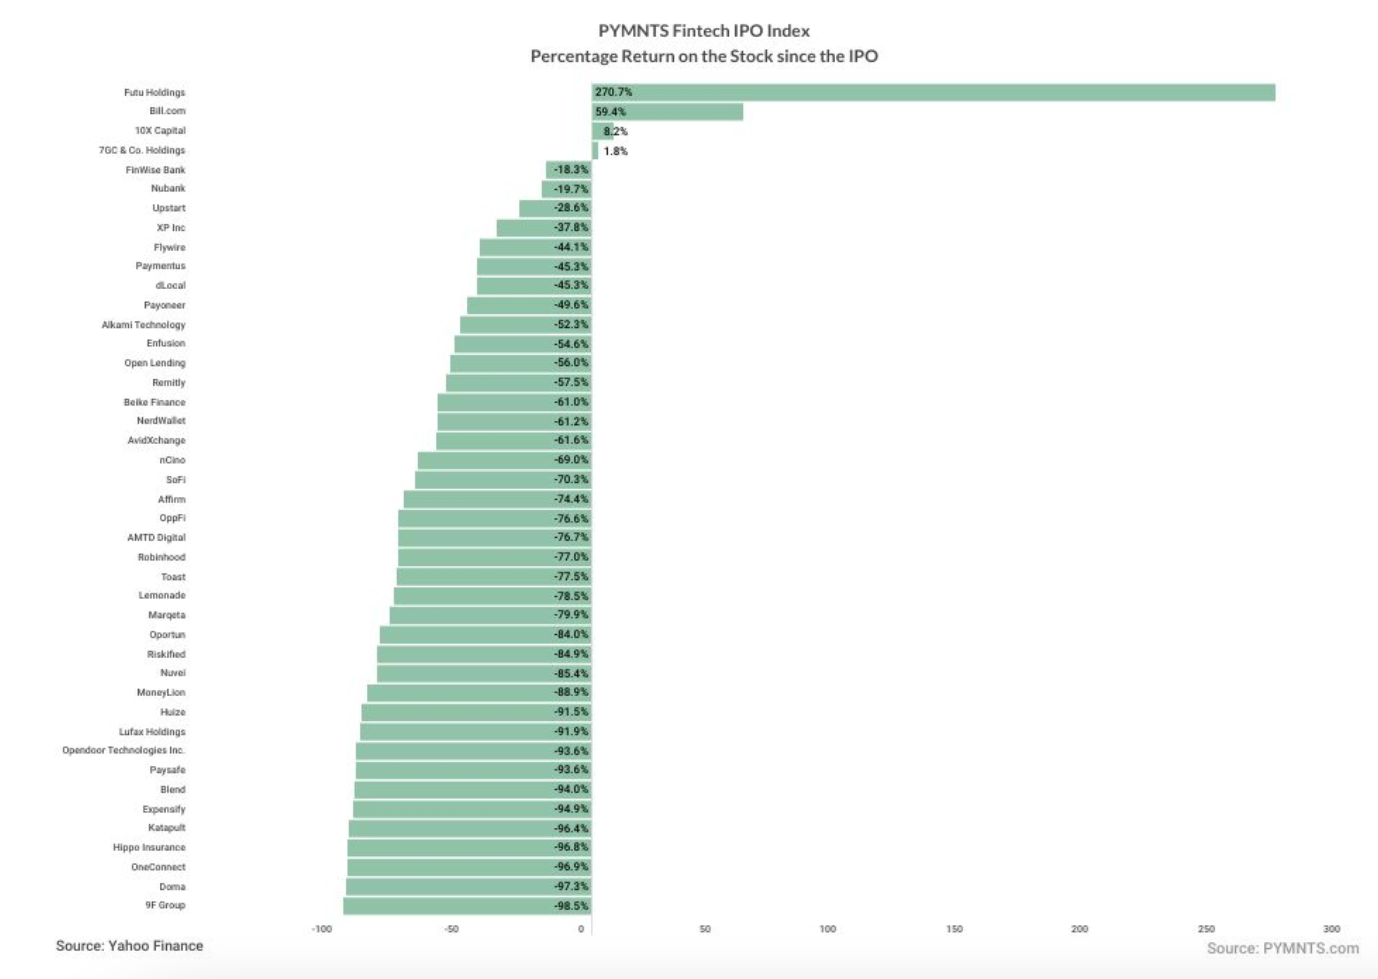
Drilling down into the individual components reveals that despite the Index’s overall rally there are several entrenched challenges. With 43 names trading in the Index, only four companies have seen positive returns since their initial public offerings (IPOs), stretching back to the months just before the pandemic. Of those, the most notable gainers have been Futu Holdings, which has been up more than 270% since its March 2019 public listing, and Bill.com, which has gathered a bit more than 59% since its December IPO.
Many of the other Index components have seen significant declines since their own listings through the years. Several companies, such as 9F Group, Katapult and OneConnect, are down more than 90% from their prices notched on the first day of trading. In Wall Street parlance, they are “busted IPOs.” Instacart, in yet another example, is trading below its IPO price, too.
There may be some further bumps and volatility ahead. As PYMNTS has estimated, the average price to sales ratio (for the trailing 12 months) of the FinTech IPO Index stands at 2.9x, which trails the Nasdaq at 4.3x. And it may be the case the lower ratio that investors are attaching to the FinTech IPO Index denotes muted expectations for the companies themselves.
What VC Trends Tell Us
Pitchbook reported last week that the valuations evident in the U.S. venture capital sector, as private money goes to work, so to speak, to find new and promising companies to back, are on a downtrend. It’s especially noteworthy that the percentage of “down rounds” has reached 17.1%, a 10-year high. A down round is a financing round where the business notches a valuation lower than had been seen in previous financing rounds, and thus the cost of buying equity in a company is cheaper (and the amount invested, of course, may be less, too). Pitchbook also reported that IPO activity overall has been muted, with 27 listings in the third quarter totaling $22 billion.
Separate data corroborates the headwinds that are well-entrenched. As reported here, 2023’s third quarter saw private investment in FinTechs slide by 46% compared to the same period in 2022, per CB Insights. The number of deals, the report added, dropped to 2017 levels. PYMNTS Intelligence data shows that the global pace of announced investments in the FinTech space has dropped to the low single digits over the past several weeks.
For the FinTech IPO firms we track, the fact that down rounds abound and that valuations from retail and institutional investors — as evidenced by the trading on public exchanges — are discounted compared to the overall market hints that “exit strategies” may be in for a reckoning. There may be no easy path to selling more shares to raise cash to help sustain operations through lean times, when capital is scarce. There may be no easy path to selling a company, in a merger and acquisition scenario, if down rounds persist. And the volatility already inherent in day-to-day stock trading may only muddy the strategic waters.