
Do you use comparison shopping engines (CSEs) when you shop online?
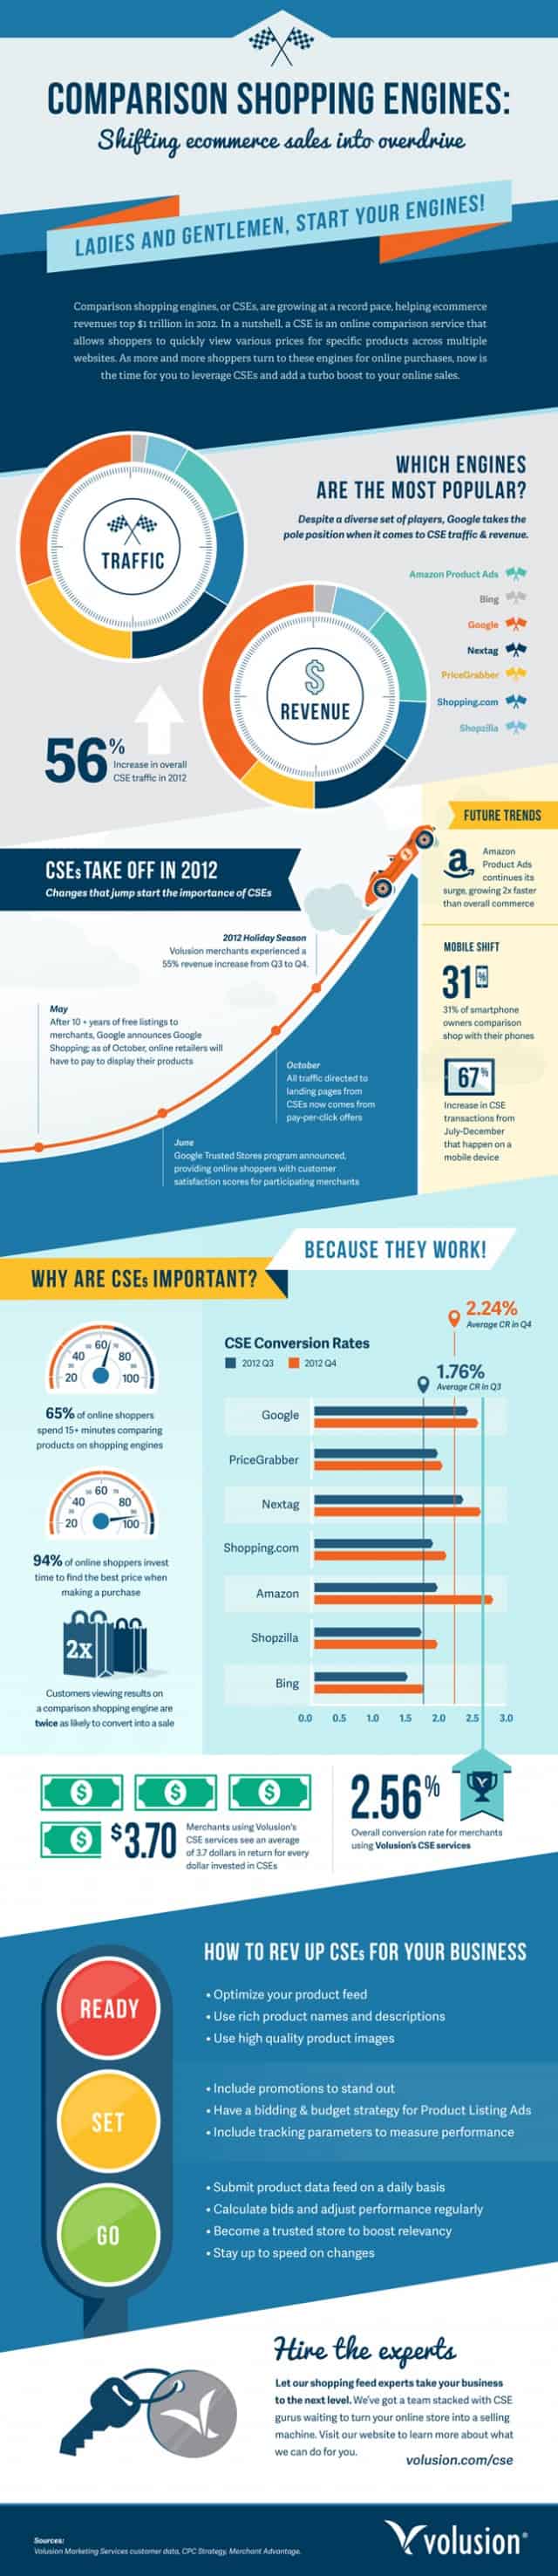
If so, you’re part of a growing segment of Americans who’ve really ramped up their online comparisons in the past year. According to a new survey by Volusion Marketing Services, CSE traffic jumped by a whopping 56 percent in 2012.
Who are the most successful CSEs in terms of traffic and revenue, and which services are gaining the most steam? We take a look at Volusion’s results – courtesy of The Daily Infographic — in this week’s PYMNTS Data Point.
Comparing The Comparers
Unsurprisingly, Google leads the competition both in terms of traffic and revenue, claiming over 25 percent of the market share for each. PriceGrabber placed second among traffic, while Amazon Product Ads and Nextag finished with around 20 percent each in terms of revenue. Nextag and Shopping.com finished similarly in terms of traffic, while Nextag and Amazon Products add saw nearly equal shares of revenue. Bing finished poorly in both results, comprising less than 5 percent of traffic and less than 10 percent of revenue.
Converting Views To Buys
The Volusion infographic also demonstrates impressive growth from CSEs even in terms of the final two quarters of 2012. Amazon saw the most dramatic jump, sitting at 2.0 percent in Q3 and .6 percent in Q3. Nextag jumped from 2.3 to 2.5 percent, while Google saw a modest gain of 2.3 to 2.4 percent. Overall, the average conversion rate jumped from 1.76 percent in Q3 2012 to 2.24 percent in Q4.
WHY CSEs Matter
According to the Volusion results, consumers are twice as likely as their non-comparing counterparts to convert views to sales on CSEs. Sixty-five percent of online shoppers spend more than 15 minutes comparing items, while 94 percent of online shoppers invest some amount of time to price comparison. The survey revealed that mobile is becoming an important CSE trend as well, as 31 percent of smartphone owners engage in comparison shopping, and Amazon Product Ads saw a 67 percent jump in mobile CSE transactions from July-December 2012.
To see more eCommerce stats, view the full Volusion infographic below.


We’re always on the lookout for opportunities to partner with innovators and disruptors.
Learn More