Across the span of more than two dozen reports since the darkest days of the pandemic more than three years ago — and with eight reports this year alone — the joint efforts between PYMNTS Intelligence and LendingClub reveal a few hard truths about the paycheck-to-paycheck economy.
The numbers fluctuate, given the month, given the season and given the state of the economy.
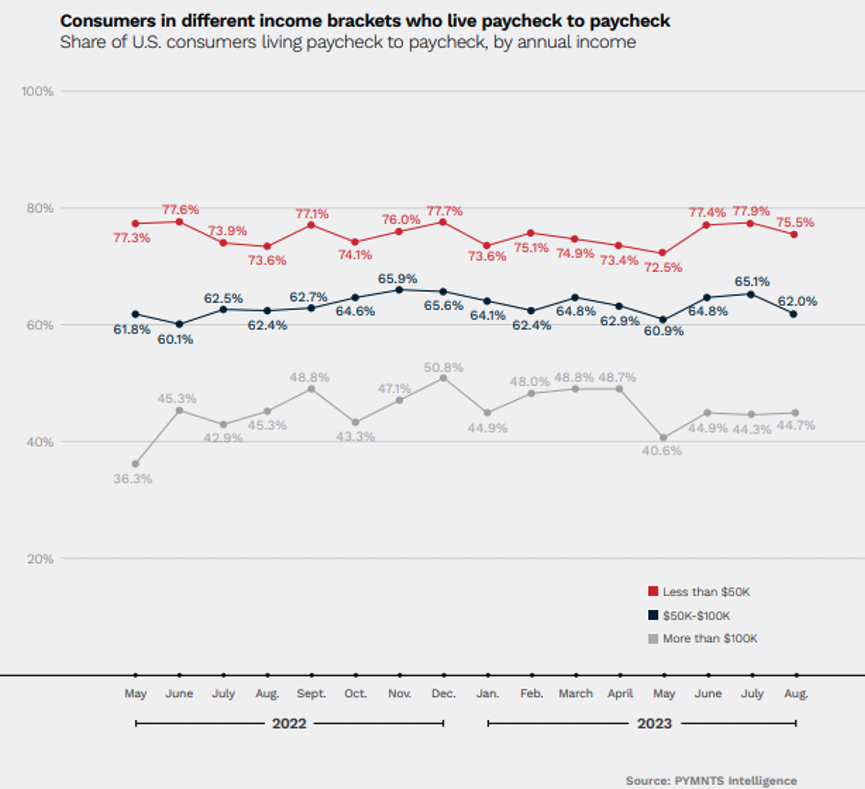
But they don’t deviate much, and the trend has proved stubborn. Consistently, an average of 60% of individuals in the United States, see their monthly obligations eat up the monthly take-home pay. Per the latest data, the percentage has inched up to 62%. And in terms of absolute numbers, nearly 10 million more consumers joined the paycheck-to-paycheck rosters by the end of 2022 than had been counted when the series began in March 2020.
Incomes? They’ve been less than a buffer than you might think. The latest report, from September of this year, showed that by August 2023, nearly 45% of those earning more than $100,000 annually lived paycheck to paycheck, up from roughly 36% just over a year ago. And across all income levels, the paycheck-to-paycheck membership rosters have been growing.
If the future belongs to the young, as the saying goes, then merchants and other businesses reliant on spending power from younger consumers might be girding for a bumpy ride in the months ahead. PYMNTS Intelligence showed that millennials, at 73% of this demographic, are the generation most likely to live paycheck to paycheck. They’re also on the cusp of seeing their spending power be significantly reduced, as student loan repayments will likely decrease disposable income by 6.5%.
Life is unpredictable, to be sure, and the inexorable rise of interest rates has made unpredictable expenses harder to deal with. Savings are waning, and as we spend more on everyday items, unexpected expenses hurt our collective financial standing even more. Real-world emergency expenses, the data showed, are closer to about $1,700, outpacing the $400 that has traditionally been the Federal Reserve’s benchmark.
There’s a level of resourcefulness apparent in the paycheck-to-paycheck economy. Research from earlier in the year revealed that about half of all employed consumers now have supplemental income sources. Side jobs have represented a financial lifeline and may be a determinant as to whether one struggles to pay the bills or manages to squeak by without a struggle. That’s because 22% of paycheck-to-paycheck consumers who do not have issues paying monthly bills said their financial grounding would seriously deteriorate without this extra income.
Nonessential Spending in Focus
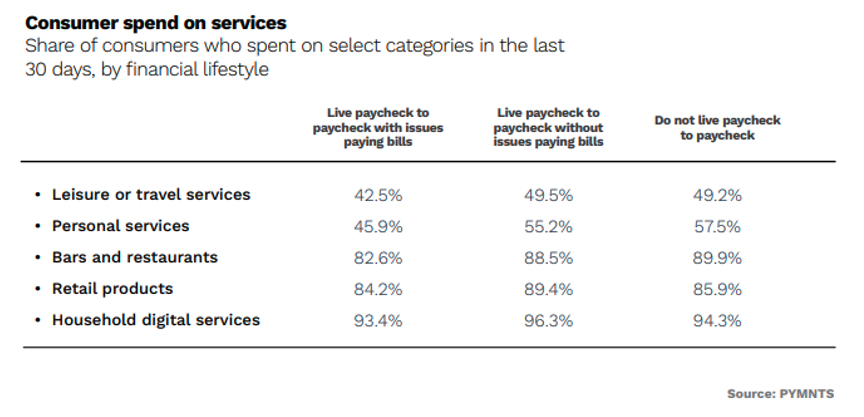
At the center of it all lies the question of what we’re spending the money on beyond the essentials, and those avenues of spending are the ones that are most easily viewed as the areas to throttle back when times prove tough. Thirteen percent of adults — or 21% of paycheck-to-paycheck individuals — have said nonessential spend is a top reason they are living paycheck to paycheck. Splurging is still the order of the day, at least recently, where nearly half of those with issues paying bills have been shelling out money on leisure and travel.
The trade-down/trade-off juggling that has been apparent in recent months looks set to continue. In one report, the data illuminated that consumers are 21% more likely to report making retail cutbacks than grocery cutbacks as 69% of survey respondents said they have lowered nonessential spending on retail goods. Sixty percent have switched to cheaper retailers. Credit has been a payment method of choice along the way, and savings have not been enough to help cover the mounting costs of credit card debt.
With all of these trends converging, the stressors seem starkly pronounced headed into the next several weeks, which include the holiday shopping season. Consumers’ financial standing fluctuates with the seasons. Forty-nine percent of consumers consider their financial situation particularly tight at specific times of the year, and most of them live paycheck to paycheck. December and November loom as the most financially challenging months of the year. Fifty-five percent of consumers face seasonal “swings” in financial security and cited events and celebrations as reasons for their pressures.