Shopping online is so 2019.
Such is the claim of analysts and pundits who point to the consumer’s return to the brick-and-mortar store as evidence of their waning appetite for digital shopping. More specifically, their claim is that the rate at which consumers shop online has returned to what would have been expected without the pandemic — that the consumer’s increased use of digital channels to shop was a blip. In 2022, shopping is now business as 2019-usual.
Undoubtedly, the highest use of eCommerce channels was recorded in the second quarter of 2020, when eCommerce shares represented 16% of sales. Since then, we have seen those levels fluctuate, decreasing to 14% by the first quarter of 2022 and more recently increasing again to a seasonally adjusted level of 15% in Q3 2022. We’ve also observed an increase in the use of brick-and-mortar retailers beginning in 2021.
However, to say that the growth of online shopping reflects longer-term pre-pandemic trends rather than a boost from the consumer’s pandemic-created reliance on digital channels is incorrect.
Here’s why.
The chart below compares U.S. census data, and projections of eCommerce sales based on eCommerce share data from 2010 to Q4 2019 (the last quarter before the pandemic began) with eCommerce sales reported by the census.
What we find is that the share of sales via eCommerce stands approximately one percentage point higher today than it would have been without the increase in use of digital channels by consumers between 2020 and 2022.
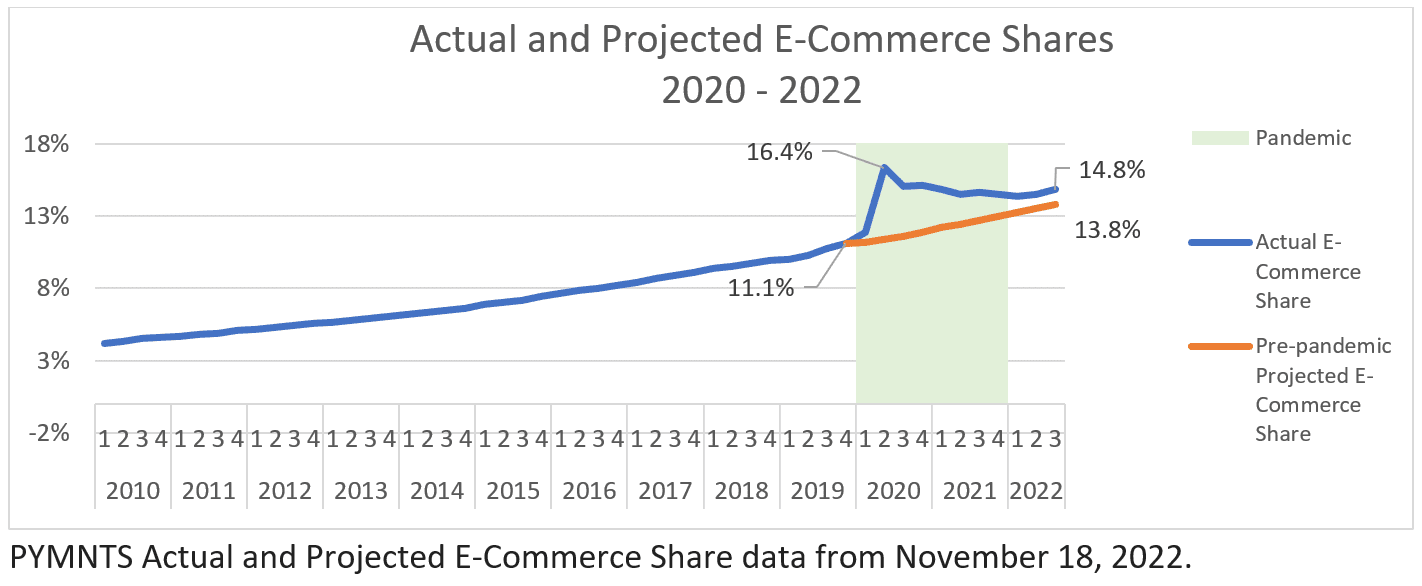
Source: PYMNTS.com, U.S. Census Bureau Data. Estimated Quarterly U.S. Retail Sales (Seasonally Adjusted): Total and E-commerce.
Although one percentage point might seem insignificant, it accounts for $81.6 billion in eCommerce sales over the last four quarters, or an 8% increase in eCommerce sales attributed to the increased use of digital channels to make purchases between 2020 and 2022. According to census data, total retail sales over the last four quarters were $7 trillion, and $1 trillion of these retail sales were made via eCommerce techniques.
These data and the conclusions drawn from them are consistent across a variety of statistical models and estimation procedures. The one percentage point difference between the actual shares of sales via eCommerce and what they would have been based on projected data is the same when making estimations based on seasonally adjusted data and data that is not seasonally adjusted.
Likewise, these results also hold if one uses simple linear regression models (OLS), or regression models with robust standard errors.
Most importantly, these results also hold even if one uses more advanced statistical techniques such as Arima models specifically designed to predict future data in a period of time.
Even as analysts revise downwards their forecasts of physical store closings, it’s easy to forget that physical retail has been in a serious state of decline since 2010 with massive store closings each year — including 9,100 in 2019. Consumers may be heading to stores more now than they were during the pandemic, but they are still using eCommerce more than they would have had the pandemic not occurred.
What all of this implies is that conclusions made about the gains of eCommerce now headed into reverse fail to analyze the data in detail, and instead jump to a conclusion unsupported by both the data and a common sense look at how consumers are shopping. PYMNTS first broke the story about inaccurate Census data reporting about eCommerce gains in May of 2022. What these data show is that what we said then about eCommerce gains getting a boost from the pandemic is, in fact, what has happened.