Revised Census Data Shows eCommerce Share Didn’t Plummet After All

In 1986, Former President Ronald Regan said that the nine most terrifying words in the English language are, “I’m from the government, and I’m here to help.”
Those who relied on February 2022 online sales data reported by the Census Bureau to adjust their business strategies or make investment decisions may have reason to be a little terrified right now.
That’s because the revised online sales data released by Census last Thursday — May 19, 2022 — stand in sharp contrast to the data Census reported three months earlier.
The Details
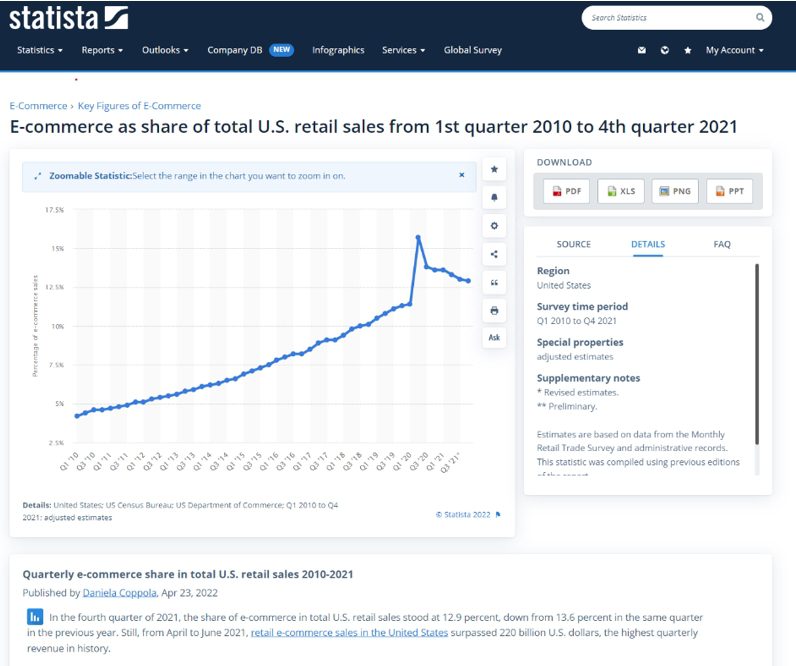
When Census released data about Q4 2021 online sales as a percentage of all retail sales in February 2022, it reported that share to be 12.9%.
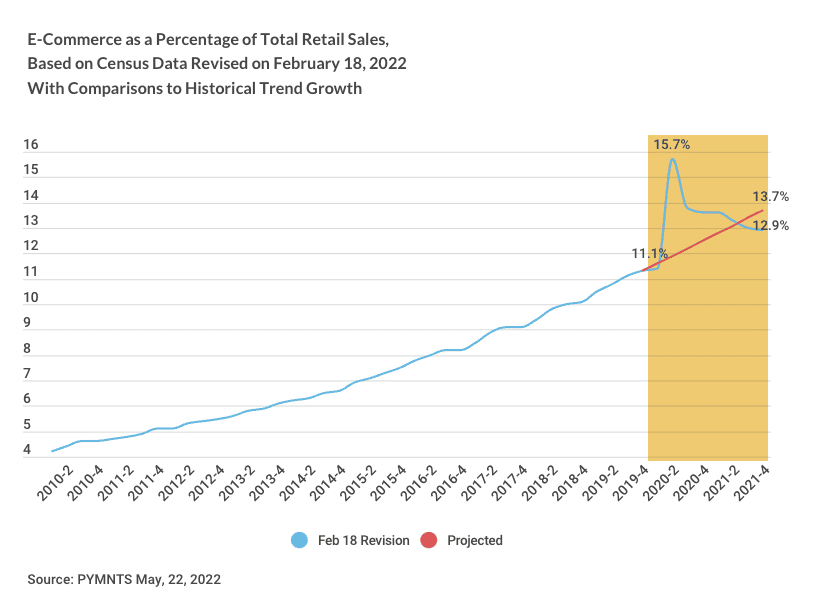
That’s substantially lower than the share would have been if the historical trend of growth in the share had continued and the pandemic had never happened: 13.7%, as I show below.
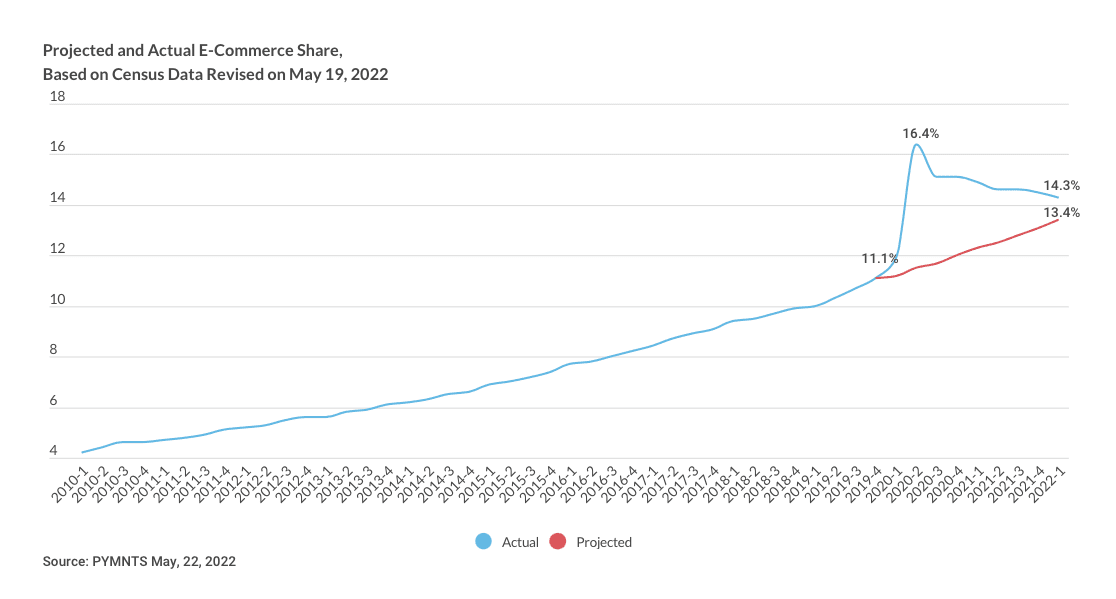
Based on the revised data Census reported last Thursday, May 19, was Q4 2021 online sales were 14.5%, a full 1.6 percent points higher than the 12.9% Census reported in February. And at least so far, their revised data shows that online hasn’t given up the boost it got from the pandemic.
This would be a stunning revision in the Census data at any time, but it’s particularly troublesome in times of chaotic markets, when even modest negative news can send investors for the exits.
PYMNTS’ data analytics team discovered the massive revision, and its implications, when using Census data to update our own last Thursday.
Here’s the whole story.
What Census Said in February 2022
In some sense, the February 2022 Census data was the data shock that roiled the market — at least the part of the market for which online sales are a material driver for business, market value and investor sentiment.
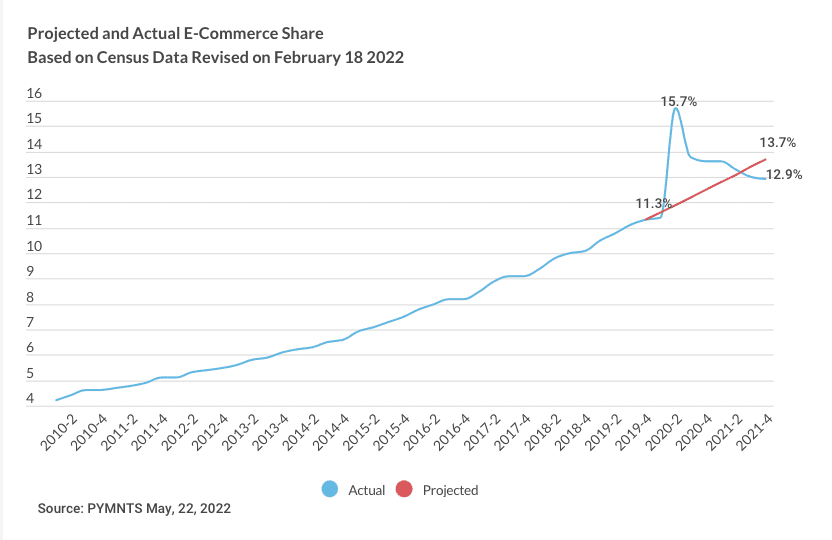
That shock came in the form of a chart (below) presented in an April 16th Wall Street Journal article using Census data to report on the impact of the pandemic on online sales growth. The chart is an “accurate” depiction of the inaccurate Census data that had been reported at that time.
That chart, using February 2022 data, showed the expected upward blip in Q2 2020 to 15.7%, then a sharp decline eventually falling to 12.9% in Q4 2021.
Eyeballing the chart makes it clear that the online share was lower than it would have been if the previous trend had just continued and the pandemic had never happened. In fact, as I’ll detail below, the online share would have been 13.7 percent in Q4 2021 if the historical trend had continued without a pandemic. So, according this chart, based on the February data, the reported online share of 12.9 percent was actually lower than it would have been without the pandemic. Coming out of the pandemic apparently caused the digital transformation to go in reverse!
But that was before Census revised the underlying data that the February chart was based on.
What Census Said in May 2022
Census released revised online sales data last week, May 19, 2022, as they do each quarter. When Census releases its quarterly numbers, it’s not uncommon to see revisions to prior quarters. Those revisions are usually no more than 1 percent and therefore have no material impact on prior quarter reporting.
Not this time.
What the PYMNTS data team saw when using their data to update our own was a stunner.
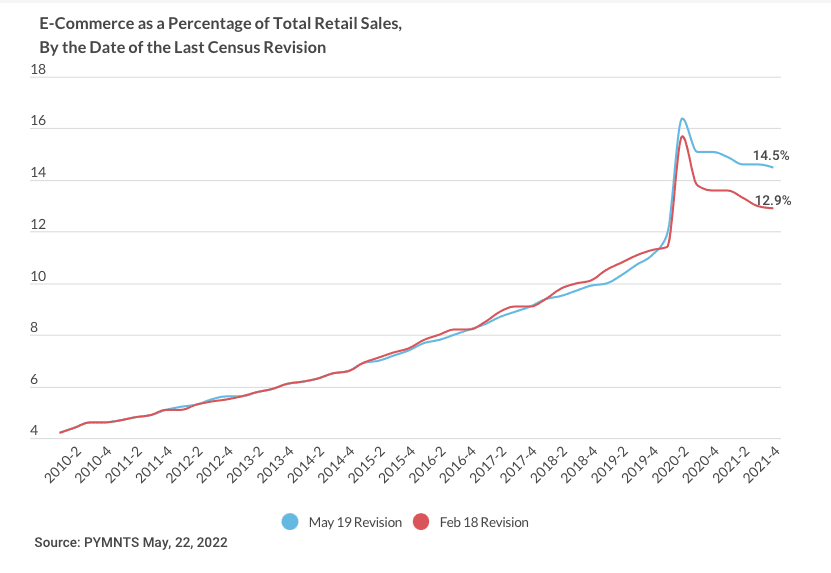
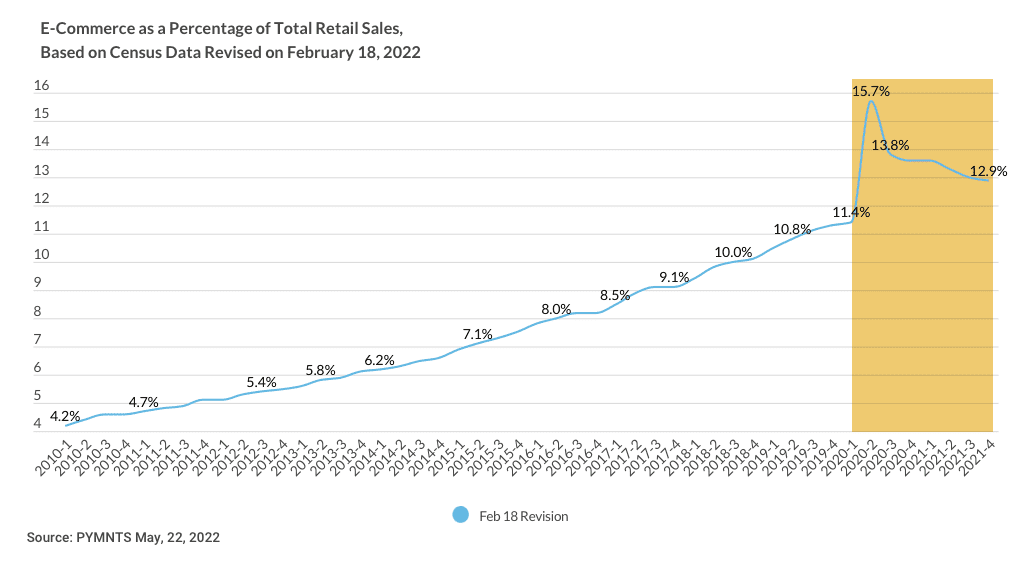
The May 2022 Census data reflected an eleven-year adjustment to online sales data — back to 2011. The revisions are fairly small until Q1 2020 — and then the revisions are substantial. The data now show a revised Q4 2021 estimate of the online share of retail sales to be 14.5%.
Comparing Q4 2021 online sales of 12.9% in February 2022 and Q4 2021 online sales of 14.5% in May, that’s an upward revision of 12.4 percent ((14.5/12.9)-1=.124).
When Census reported their May numbers, they said nothing about the dramatic adjustment upward in the share of online sales. PYMNTS reached out to Census asking for a comment. As of the time this piece published, we have not had a response to that query.
The February 2022 Census data are no longer online, even though the Census press release that announced those data in February can be found here.
Reputable data aggregators used Census data to update their own charts. See this one from Statista, accessed on May 20, 2022, using Census data from February to reproduce the same chart as seen in the April 16th Wall Street Journal.
I’m also pretty sure that you can find Census’ February 2022 Q4 2021 data cited in dozens of presentations across the payments and investor ecosystem too. Possibly even some of your own.
Believing Census Data or Your Own Eyes
February 2020 Census Data notwithstanding, a good old-fashioned gut check about what they had reported — and the doomsday predictions about the future of online commerce that followed — should have raised four very big red flags, given what they assumed or implied.
One: That none of the digital experiences introduced by merchants and payments providers in 2020 and 2021 would stick, even a little. To most people that I spoke with after this data was reported, it seemed implausible and nearly unbelievable. No one believed that the innovations introduced and used by consumers between 2020 and 2021 were just a big COVID band aid that they’d rip completely off the second they could go back to physical stores, that none of the conveniences people became accustomed to during the pandemic would stick, that consumers would emerge from the pandemic less likely to use online than before.
Related: Aggregators’ Growth Shows Delivery Habits Buck the Great Reopening
Two: That online was an all-or-nothing proposition. No one, even the most ardent online commerce enthusiasts, ever thought that consumers would completely abandon physical stores and live their lives only online. The notion that consumers would shift all of their shopping online was a false assumption, even though it is inevitable that the majority of physical interactions — shopping and almost everything else — will be enabled via a device connected to the internet at some point in the future. That’s because it’s already happening everywhere in the world.
Read also: Retailers Rush to Rethink Stores Amid Shift to Digital, Experiential Shopping
Three: That all of the data captured and presented from a variety of sources about the consumer’s digital shift was off-base. The Census data also seemed antithetical to the monthly Census-balanced studies of consumers’ digital behaviors that PYMNTS had been capturing and reporting since March 6, 2020. What our data showed was consumers returning to the physical world, but continuing their activities in the digital world as well: ordering ahead using their mobile devices to pickup in store, ordering groceries online yet still shopping in grocery stores for grocery items, eating out at restaurants while still ordering food from aggregators to eat at home.
See the study: 2022 Global Digital Shopping Index
PYMNTS’ April 2022 monthly consumer shopping data shows that 33% of consumers made retail purchases online that month, up from 29% in March 2022. This shows that eCommerce doesn’t exclude shopping in the store — but in-person commerce doesn’t exclude using digital channels to buy things, either.
See also: Digital Economy Payments: How Consumers Pay In The Digital World
It’s what prompted me to write about it last week, using PYMNTS data to push back on what was starting to seem like conventional wisdom about the end of online and the digital transformation.
Read more: RIP Digital Transformation, We Hardly Knew Ya
Four: That online sales growth would suddenly stall after more than two decades of steady growth. That is despite the pandemic forcing most people to change their habits and try online solutions. As part of our analysis over the last several days, the PYMNTS data team projected what the online share would have been in Q4 2021 if the 2010-2019 trend had just continued through Q4 2021 absent the pandemic. As I stated earlier, using a simple trend line projection, we find that the online share of retail sales would have been 13.7% in Q4 2021 compared to the 12.9% based on the data Census released in February.
If the February Census data were correct, that would imply that online sales were 1.8 percentage points below the trend line following the two years of pandemic-caused lockdowns of the physical world.
What’s Next
Using the revised May Census numbers, PYMNTS data team shows Q1 2022 online sales as a percentage of overall retail sales at 14.3%.
That is 0.9 percentage points higher than the historic pre-pandemic trend.
At least so far, this suggests that there is some persistence to the boost online got from the pandemic. Of course, it’s possible that online may give up some of that boost as the effects of the pandemic recede.
The May Census data revision is very important for everyone attempting to evaluate the digital transformation.
As of Q1 2022 online sales are up to 14.3 percent compared to 11.1 percent in Q4 2019. That’s almost a third higher (although slightly down from the 14.5 percent in Q4 of 2021).
The pandemic appears to have given online retail sales a boost.
And, that’s a data-driven cause for optimism about the digital economy and the businesses that are driving it.