Sixty-one percent of consumers purchased almost exclusively daily essential items like gas, health products and food in March, according to “The ConnectedEconomy™ Monthly Report,” which is based on a PYMNTS survey of roughly 2,500 U.S. consumers.
Get the report: The ConnectedEconomy™ Monthly Report
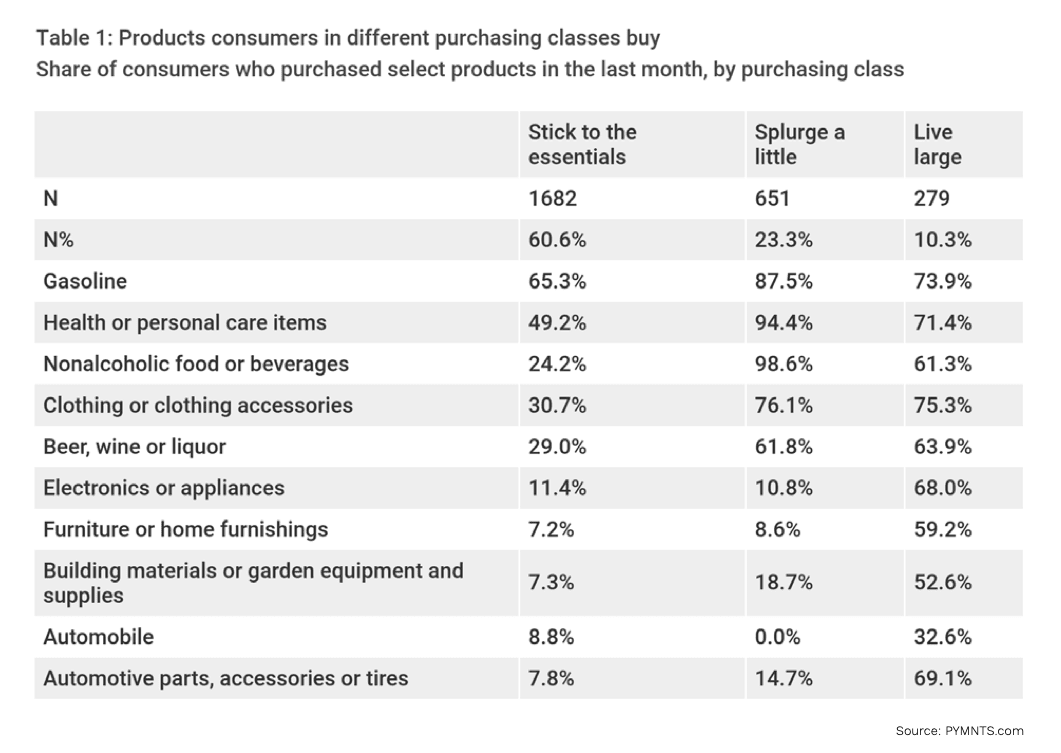
Among these “stick-to-the-essentials” consumers, 65% purchased gas, 49% purchased health or personal care items and 24% purchased food or beverages in the last month.
These consumers spend nearly three times as much on gas as they spend ordering from restaurants.
Smaller shares of consumers fall into three other purchasing classes identified by PYMNTS. Twenty-three percent of consumers are in the “splurge a little” group whose major purchases include alcohol and apparel.
Ten percent of consumers are in a “live large” purchasing class whose major purchases include higher-ticket items such as electronics, appliances and home furnishing.
Just 5% of consumers are in the “don’t need much” category, buying infrequently and only when they need something.
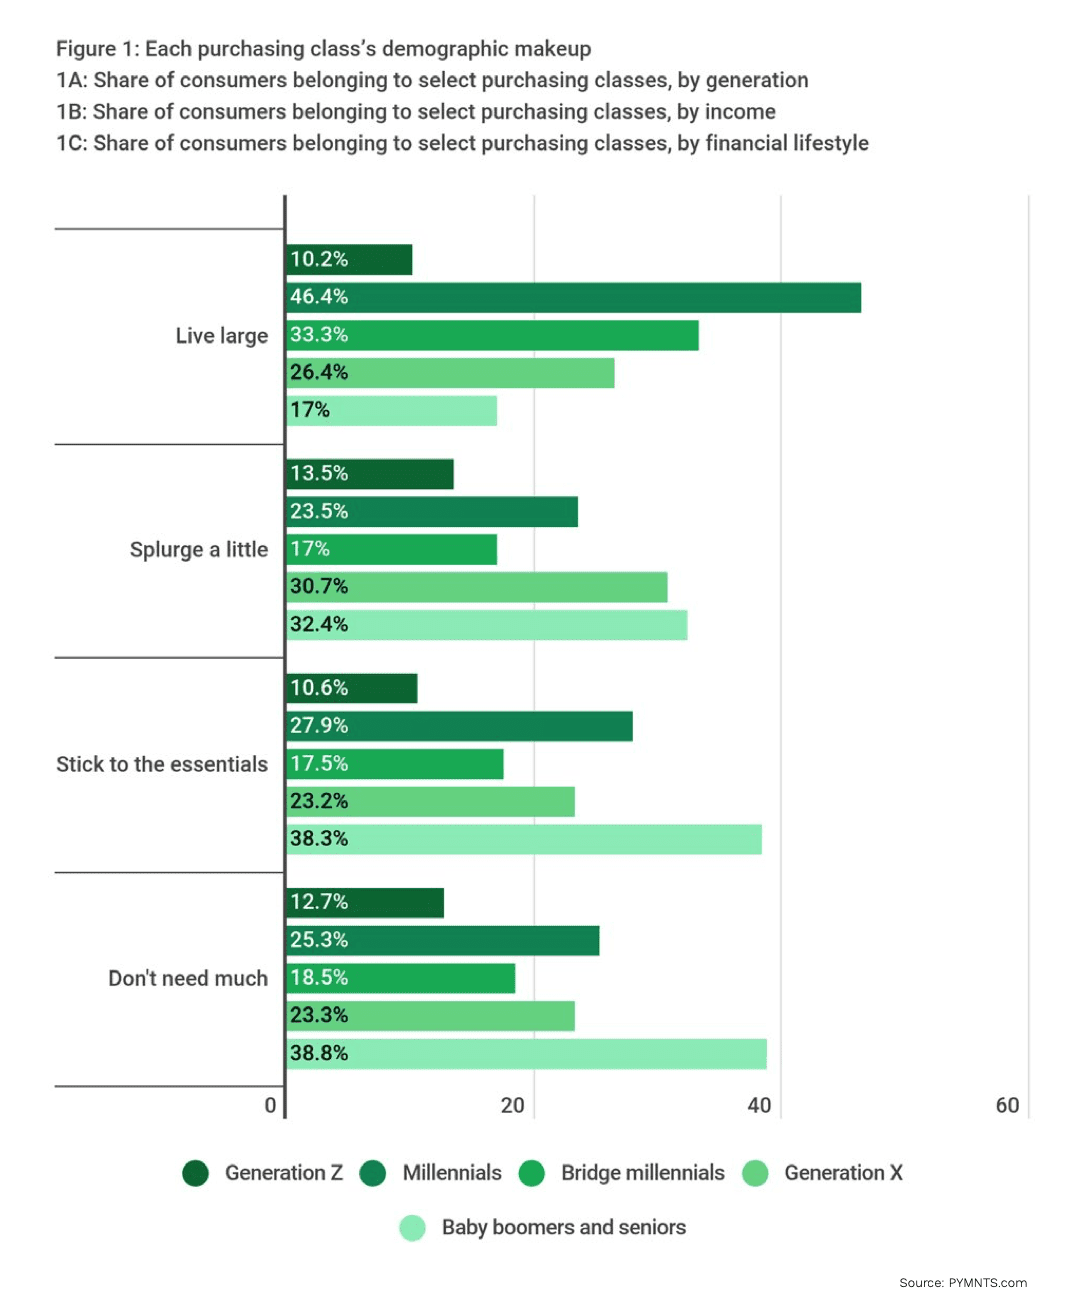
Baby boomers and seniors account for the greatest share of the “stick-to-the-essentials” consumers, at 38%, followed by millennials and Generation X at 28% and 23% respectively.
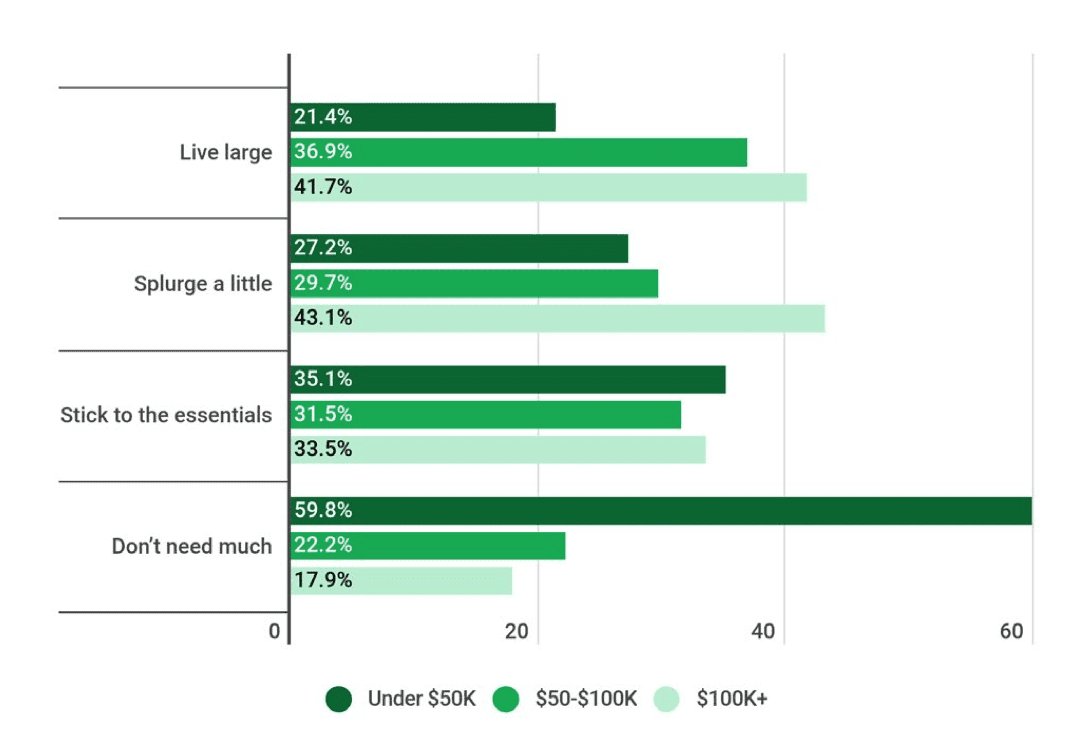
The income of “stick-to-the-essentials” consumers varies, with each of the three income groups identified in the study accounting for about one-third of this purchasing class. Thirty-five percent of these consumers make under $50,000, 32% make $50,000 to $100,000 and 34% make $100,000 or more.
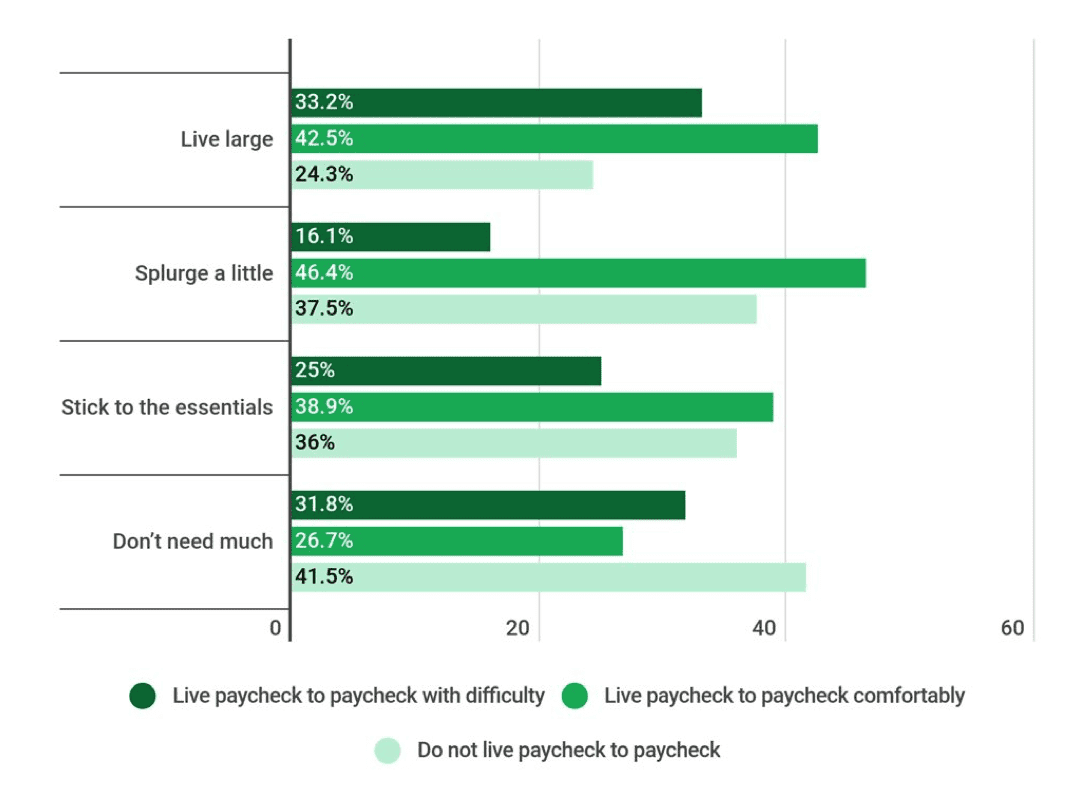
Nearly two-thirds of “stick-to-the-essentials” consumers lived paycheck to paycheck, with 39% living paycheck to paycheck comfortably and 25% living paycheck to paycheck with difficulty.
The other 36% do not live paycheck to paycheck.