Big news in the U.S. last week as figures from the Census Bureau and Treasury Department pointed to an economic recovery gaining momentum as the U.S. consumers have been receiving their latest and largest stimulus checks to date over the last several weeks.
U.S. household incomes were up 21.1 percent in March, pushed in large part by federal relief funds, the expansion of vaccinations and the concurrent easing of COVID-19 restrictions. According to Wall Street Journal reports, the recent boost in U.S. income was the largest monthly increase observed since 1959. Moreover Very, The Bureau of Labor Statistics on Thursday (April 29) reported U.S. gross domestic product (GDP) in the first quarter of 2021 grew 6.4 percent, the biggest increase for any first quarter since 1984.
The biggest bump was in durable goods spending, which was led by motor vehicles and parts.
And perhaps unsurprising, the GDP and income bump and produced a spending bump of 4.2 percent, the biggest month-over-month boost seen since last summer, according to Commerce Department reports from late last week; while savings has also remained on the rise, up a whopping went up 27.6 percent in March from 13.9 percent the previous month.
“While we aren’t completely out of the woods yet, today’s report shows the beginning of an economic rebound,” said Brendan Coughlin, head of consumer banking at Citizens in Boston, told Reuters. “Assuming no setback in the continued rollout of the vaccines, U.S. consumers are well-positioned in the second half of the year to stimulate strong economic growth across the country.”
The rebound, the experts seem to agree, comes care of the latest $1,400 per citizen round of stimulus circulating as part of the larger $1.9 trillion March fiscal relief package, which, according to expert analysis, was a bigger igniter of consumer spending than its two predecessors, said to data-analytics company Earnest Research.
Spending increased 29 percent among those who received a check in mid-March compared with the same period in 2019, according to Ernest data, with the first round boosted spending 23 percent and the second stimulus checks bumped spending up 22 percent. And those are just the national averages — individual locales like Pennsylvania, Texas and Florida have seen growth faster than those national averages.
Moreover, the bump in personal income is mostly fed by stimulus funds, but according to the data out at the end of last week, it is not entirely created by it. Wages are also increasing, according to a separate Labor Department report released last Friday (April 30) that indicates that the Employment Cost Index, the broadest measure of labor costs, jumped 0.9 percent in the first quarter, the biggest pick-up logged since 2007.
The ECI is taken by experts to be one of the better measures of labor market slack and a predictor of core inflation. Last quarter’s increase was driven by a 1 percent rise in wages, the biggest gain logged in over 14 years — with bigger increases observable in segments hit particularly hard by the pandemic — accommodations and foods services, for example, were up 1.7 percent in the time period.
It was a lot of information — mostly positive to cap off the week. Axios led its reports on the boom week in U.S. Economic numbers with the headline “Here Comes The Reopening Boom” and concluded its coverage with “ get used to a lot of chards going up and to the right.”
But the data out this week is perhaps a bit more nuanced and complicated to parse than a blanket declaration that blue skies are here again in the wake of the vaccine. The great build-up in savings, it has been widely reported, has not been an evenly distributed phenomenon.
Most of the accumulation in U.S. wealth, about two-thirds of it, according to Federal Reserve figures, was accrued by the richest fifth of the population — with roughly a third accumulating to the top 1 percent and a third going to the top 20 percent. The bottom 20 percent demographic, by contrast, its deposits fell to just over a tenth of what they were pre-pandemic.
The great savings building up, according to Census data, was also skewed largely toward older consumers — people between ages 55 and 65 increased their checking deposits by $614 billion. In comparison, those 70 and over increased their holdings by $664 billion. But for all adults under 40, the increase was around $245 billion.
The concern among economists is that if the biggest uptick in funds flowed to older people who were already well off, those savings won’t make their way into the economy as fast or fully as would be desirable for fueling a fast recovery.
“On the one hand, there is little doubt that many will enjoy a few extra restaurant meals and perhaps splurge on a nicer vacation after such a long period without them,” said Florin Bilbiie, a professor of economics at Switzerland’s University of Lausanne told the Wall Street Journal. “On the other hand, there is a limit to how many extra restaurant meals and vacations people will be able to enjoy.”
Some economists, like Oliver Rakau at Oxford Economics, notes that even if many hold on to their pick-up funds as a windfall, those who do spend will do so powerfully enough to generate big growth — forecasting that European households will spend about a fifth of their accumulated savings through 2025, creating a 3.1 percent increase in consumer spending this year, and a 7 percent rise in 2022, when the economy is expected to be more fully open.
And in the U.S., economists are forecasting similarly powerful growth driven by the perhaps rather dedicated minority whose spending is due for a massive uptick. Most economists are projecting to expect double-digit growth this Q2, which would position the economy to achieve growth of at least 7 percent this year, its fastest rate since 1984.
A powerful projection, tempered by the reality of the economy in the U.S. contracting 3.5 percent in 2020, its worst performance in 74 years.
And it is perhaps also worth noting that the economy that is coming back won’t be quite the same.
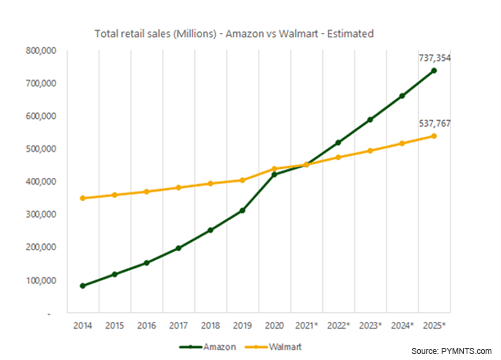 Amazon, for example, has been for the last decade chipping away at Walmart’s lead in terms of the total share of U.S. retailers. In the last year, Amazon has more or less closed what was once a pretty sizable gap in Walmarts favor — creating what is now a neck-and-neck dead heat, with each controlling approximately a 9 percent share of total U.S. retail sales.
Perhaps more interesting, PYMNTS data also indicates they aren’t going to be neck and neck for long. Barring some major change in the trajectory of things to come, that gap will only get bigger. Looking forward five years, PYMNTS is projecting that Amazon will be doing roughly $737 billion in sales for a $200 billion or 37 percent revenue margin over Walmart’s projected $537 billion revenue target for 2025.
The world is coming back — that the data makes it unmissable and the entire economy is gearing up for some big growth. But just how big — and where exactly that growth is going to go?
That, it seems, is a story still being written in real time.