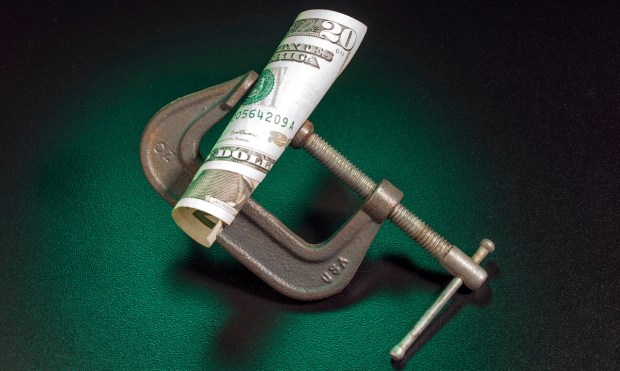
Inflation absorbed almost all of United States consumers’ September spending increase, leaving households paying more for barely any additional goods and services.
The monthly result complicates the stronger growth picture in the third-quarter GDP estimate that the Bureau of Economic Analysis announced Thursday (Oct. 29). The economy expanded at a 3.4% annualized rate, up from 2.2% in the second quarter, with consumer spending contributing to growth. Yet the quarter ended with little improvement in consumption after accounting for prices.
The quarterly inflation figures showed relief. The personal consumption expenditures price index rose at a 2.1% annualized rate, down from 5% in the second quarter. Excluding food and energy, the rate slowed to 2.5% from 3.3%.
September’s reading on the PCE price index showed prices 3.6% higher than a year earlier, compared with August’s 3.4%. A slower quarterly inflation rate and a higher September year-over-year reading measure different periods; neither cancels out the other.
The immediate squeeze appears in September’s income and spending figures. Consumer spending increased 0.5% from August in current dollars, while prices also rose 0.5%. Inflation-adjusted spending increased less than 0.1%. Disposable income rose 0.2% before inflation but fell 0.3% after it.
Households collectively spent more while their after-tax purchasing power declined. For payments businesses and merchants, higher dollar volumes alone wouldn’t establish that customers are buying more. September’s consumption figures show how closely spending growth can track the cost of maintaining purchases.
A quarter of expansion can contain a weak closing month. Businesses planning for year-end demand need to distinguish the quarter’s accumulated growth from the spending momentum consumers carried into October.
We’d love to be your preferred source for news.
Please add us to your preferred sources list so our news, data and interviews show up in your feed. Thanks!
Where the Money Goes
Healthcare, particularly hospitals and outpatient services, helped lead growth in services consumption. Prescription drugs led the increase within other nondurable goods, the goods category BEA identified as the largest contributor to goods spending growth.
Medical consumption includes purchases made on consumers’ behalf, so these gains shouldn’t be read as a direct measure of what households voluntarily spent from their checking accounts. They also don’t establish that families have more money available for discretionary purchases.
Food services and accommodations, led by purchased meals and beverages, also contributed to services growth. Consumers haven’t abandoned spending outside essentials. The mix supports a more selective reading. Medical demand and dining both supported consumption, without proving that every retail category benefited.
Evidence of purchases forgone comes from the October PYMNTS Consumer Expectations Index. The index, based on 2,087 consumers, found that 22% reported delaying a major purchase during the 90 days before being surveyed, up from 18.3% in August; 11.1% reported canceling one, compared with 9.6%.
Among consumers who traded down, delayed or canceled a major purchase, 34.9% named high prices as their main reason. These responses identify restraint that aggregate consumption growth doesn’t reveal.
The index also showed room for spending to continue. The share of consumers calling October a good time for a major household purchase rose to 25.5% from 22.8%. Improving buying sentiment coexisted with decisions to wait.
Repayment behavior showed a similar divide. Among cardholders struggling to pay bills while living paycheck to paycheck, 40.7% said they paid balances in full less often than a year earlier. Among those not living paycheck to paycheck, 4.5% did so.
The GDP report supports continued consumption growth; September’s purchasing power squeeze makes the financing and composition of that spending essential to assessing household health.


 Add as Preferred Source