The great digital shift has been felt all over the world over the course of the last year, as shutdowns and concerns about the pandemic steered consumers away from their physical routines and toward adopting a greater degree of digitization in their day-to-day lives.
But, as PYMNTS survey data in the U.K., the U.S. and Australia have demonstrated, the pace and preferences embodied within that shift have not been quite the same everywhere. So where are consumers behaving similarly, and where does the region make all the difference in which digital behaviors consumers are leaning on the most? PYMNTS has it all here, in five easy pieces.
1. The Digital Shift Has Happened In All Three Places, But Not At The Same Level
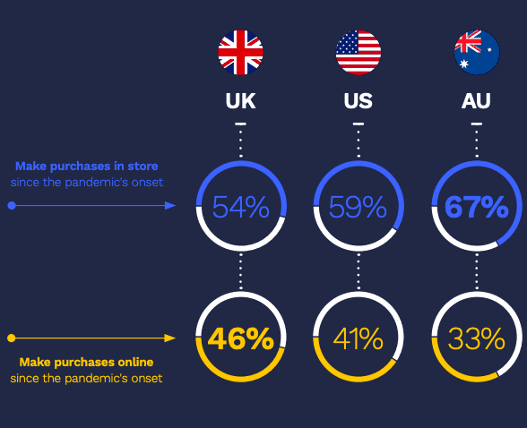
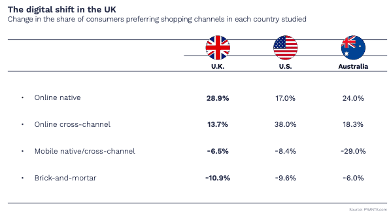
Consumers in the U.S., U.K. and Australia have all shifted their habits toward online channels, but the degree of that shift has not been consistent across locations. Carrying the digital flag highest is the U.K., as 54 percent of its consumers now prefer in-store shopping, marking an 11 percent decline from the share that preferred it prior to the pandemic. Online-native shopping journeys, on the other hand, have increased by 29 percent since the pandemic’s onset, making it the most preferred shopping method for nearly one-quarter of U.K. consumers.
The U.S. is the middle player on the field, with 59 percent of consumers now reporting the physical store as their preferred shopping location, while the digital-native shopping journey jumped from 27 percent of purchases to 42 percent in the early pandemic period.
Australia, meanwhile, is a bit of an outlier in the group: According to PYMNTS’ digital shopping index, 67 percent of ITS consumers still report a preference for physical shopping, though online shopping has picked up by 24 percent over the course of the pandemic.
2. Contactless Is Advancing Far Faster In The UK And Australia Than In The US
Consumers don’t want to contract the virus or be responsible for giving it to anyone else, as evidenced in all three countries by a notable embrace of contactless payment methodologies. But the difference in those rates points to the reality that both the U.K. and Australia were already well into the era of contactless card purchases before the pandemic formally began last March.
In the U.S., 20.4 percent of consumers report leveraging contactless payments more in the post-pandemic world than pre-pandemic. That puts it in fourth place among adopted new behaviors, falling behind BOPIS, online inventory checks and mobile order-ahead.
On the other side of the world in Australia, the data is quite different. Nearly 47 percent of the population uses contactless payments via cards or, to a lesser extent, digital wallets — nearly three times the share of U.S. consumers.
Australian consumers’ tendency to use contactless cards may correspond to greater adoption of other touchless payment technologies: 17.5 percent of Australian consumers say they employ touchless payment methods in addition to contactless cards, whereas 13 percent of Americans say the same.
And the U.K. is actually the strongest contactless locale PYMNTS studied, with 55 percent reporting using this feature — a large share that reflects the widespread availability of the technology among consumers and merchants. And like Australian, that preference for contactless is connected to a stronger preference for touch-free payments, as 2o percent use their phones to make touchless payments or scan barcodes in stores.
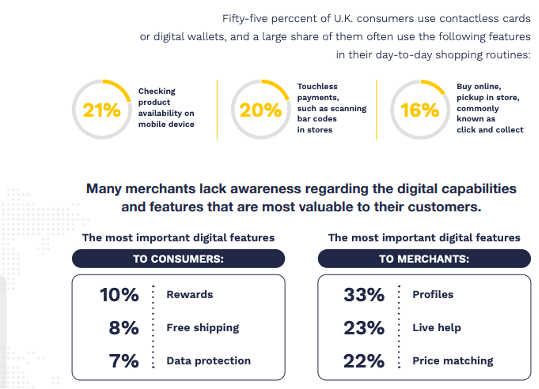 3. Merchants Underestimate The Value of Free Shipping Worldwide
Everywhere on Earth, it seems, consumers put a high value on free shipping. PYMNTS found that Americans value it particularly, with 56.1 percent of consumers regarding it as an important feature. Thirty percent of U.K. citizens report the same, while only 10.2 percent of Australian consumers said as much.
But despite the varying levels of importance that consumers assigned to free shipping, according to PYMNTS data, U.S. consumers are 1.6 times more likely to value free shipping than merchants.
A similar mismatch is apparent in the U.K., where free shipping makes the consumers’ list of top three things valued in a commerce experience, but it doesn’t make the merchants’ top three.
Even in Australia, where the desire is comparably lower, the mismatch is still apparent — only 3.8 percent of merchants call out free shipping as particularly valuable, as opposed to over 10 percent of consumers.
4. Cross-Channel Preferences Vary By Location
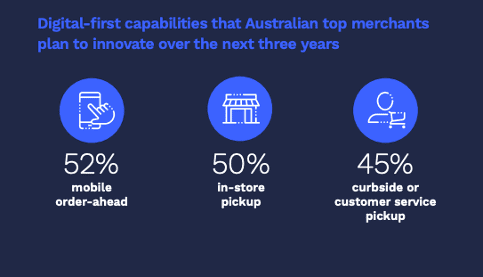
According to the data, Australians are less averse to going into stores when doing cross-channel shopping. More than one-quarter of Australian digital shoppers use in-store pickup — nearly twice the share of U.S. consumers, who tend to prefer curbside pickup. That difference in preference may also reflect the reality that curbside pickup is a less developed practice in Australia, while in-store pickup — commonly known as “click and collect” — has long been gaining traction.
The U.K. is a bit more moderated between the U.S and Australia, according to the data. Click-and-collect is also gaining speed in the U.K., but buy online, pick up curbside still represents the more popular option — 16.4 percent identifying it as their most-used digital feature, whereas 13.3 percent identify buy online, pick up in an in-store kiosk as their favored method. U.K. consumers are also somewhat distinct in their sense that existing click-and-collect services could be better. A significant share of U.K. consumers employ online cross-channel shopping journeys, but they score considerably lower in our Satisfaction Index than consumers in Australia and the United States, earning 68.6 Index points versus 123.8 in the U.S. and 108.9 in Australia.
5. UK Shoppers Are Uniquely Interested In Digital-First Features
 U.K. consumers are uniquely focused on digital-first features, and this interest spans product categories to a greater extent than what was observed in the U.S. or Australia.
Thirty-five to 42 percent of U.K. consumers would be interested in using digital-first features in segments such as electronics, hobbies and games, clothing and groceries, while 35 percent of U.K. consumers would be interested in using digital features for groceries compared to 31 percent of U.S. consumers and 26 percent of Australian.
The U.K. also experienced the least growth in online cross-channel shopping after the pandemic’s onset: 14 percent versus 38 percent in the U.S. and 18 percent in Australia.
Read More On The Digital Shift: