
Fraudsters seem to have embraced the Puritan work ethic: Idle hands are the devil’s workshop. And they’ve been anything but idle. The hot-off-the-presses Global Fraud Attack Index™ shows that fraud attacks have jumped 137 percent over the four quarters ending March 2016. The index reveals the tools the fraudsters are using to launch their attacks and what merchant segments they seem most enamored with.
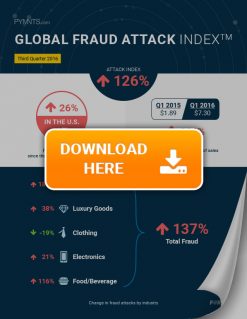
Fraudsters are on a train that is anything but slowing down. In just the last four quarters, fraud attacks have jumped by 137 percent, affecting over $7 out of every $100 made in retail sales.
Their new favorite? Digital goods. With a 186 percent spike, fraudsters seem to be fixated on attacking digital goods transactions, followed by their second favorite category: food and beverage, which showed a 116 percent increase, according to the latest data from the Global Fraud Attack Index™, a PYMNTS and Forter collaboration.
If that weren’t troubling enough, merchants are now being forced to bend over backwards to combat alarming levels of fraud originating outside the U.S. The total number of fraud attacks from the rest of the world (ROW) have dramatically grown by 200 percent.
This spike in fraud comes against an ever-increasing cost of fraud. For attacks originating in Europe, the cost went up to 18.9 percent in Q1 2016. On the other hand, the cost increased by 14.4 percent over last quarter for transactions originating in ROW.
Other key takeaways from the Global Fraud Attack Index™ for the third quarter of 2016 include:
There were 34 attacks for every 1,000 transactions in Q1 2016. That’s a 126 percent increase over the four quarters ending March 31, 2016.
The attack rate tripled for digital goods over the same period and more than doubled for luxury goods.
The number of attacks from botnets surged from seven per 1,000 in Q2 2015 to 27 per 1,000 in Q1 2016.
About The Index
The PYMNTS and Forter Global Fraud Attack Index™ quarterly analyzes fraud attempts on U.S. merchant websites, reflected as a percent of U.S. sales transactions, and tracks what’s trending. Have the attacks gone up? Down? Stable?
That’s pretty critical since the key to preventing fraud is understanding where fraud is originating, what tools the fraudsters are using and which industries and areas they are targeting.
The Fraud Index reports this in several ways. Each index includes a metric which quantifies the rate of fraud attempts on U.S. online merchants and how that changes over time. The index examines different aspects of fraud, like which countries or regions are most seriously threatened by fraud and which industries should take a closer look at what’s happening around them. It also explores what can be done to stop or slow down fraud trends and how those methods are (or are not) working.
To download the 2016 Q3 PYMNTS Global Fraud Attack Index™, powered by Forter, click the button below.

We’re always on the lookout for opportunities to partner with innovators and disruptors.
Learn More