While the Great Recession technically began in Dec. 2007, most people remember a different date as the “real” start to the Great Recession: Sept. 15, 2008. That was the day Lehman Brothers officially filed for bankruptcy. Six days later, The New York Times reported that Bear Stearns was dangling on the edge of bankruptcy and a forced liquidation after it posted a 61 percent drop in net profits as a result of hedge fund losses in the subprime mortgage market.
The concern then was that Bear Stearns would fall and set off a cascade of banking failures that would knock the U.S. into a depression à la 1929.
The worst did not come to pass — Bear Stearns was bailed out and eventually bought out by JPMorgan Chase. On Oct. 3, Congress passed the Emergency Economic Stabilization Act of 2008 and created the Troubled Asset Relief Program (TARP). Through TARP, $700 billion of federal money was released to stabilize the financial system during the crisis with a big injection of liquidity. Insofar as the big banks didn’t fall like dominos, and the economy didn’t melt down entirely in a barter system, the TARP program worked.
Theoretically, things could have been much worse. And 10 years later, it might be easy to say all’s well that ends well.
Now, the stock market is on the verge of completing its longest bull run in history, If things don’t go radically off the rails between now and tomorrow (Aug. 22), the bull run will set a record at nine years, five months and 13 days. Unemployment is below 4 percent, wages are growing and retail sales are surging. It’s a lot of green, upward pointing arrows.
So, time for party hats? Well…
The data picture is a bit more complex than a quick look, and possibly a bit more worrisome in some spots. Americans are doing better than they were a decade ago, but perhaps not as well as well they should be.
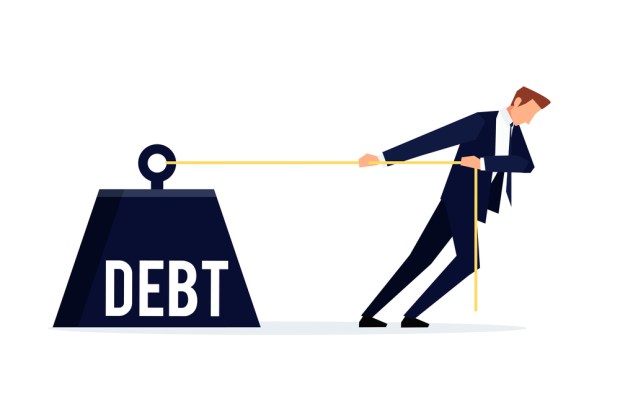
Debt levels, well, those continue to creep up, both for consumers and businesses, which is to be expected in an economy as robust as the U.S. right now. That doesn’t mean we shouldn’t keep a careful eye on what could be next.
The $70K Lifetime Loss (And Other Interesting Figures About Our Financial Futures)
According to a recent report released by the San Francisco Federal Reserve Bank, however much better Americans are doing, they are still feeling the bite of the recession — even if they aren’t feeling it acutely. The study said that since the U.S. economy today is clearly lagging in what pre-crisis trends predicted it would be, every American is out $70,000 on average over a lifetime of post-crisis earnings.
“The size of the U.S. economy, as measured by GDP adjusted for inflation, is well below the level implied by the growth rates that prevailed before the financial crisis and Great Recession a decade ago,” the report noted. “The size of those losses suggests that the level of output is unlikely to revert to its pre-crisis trend level. This represents a lifetime present-value income loss of about $70,000 for every American.”
Moreover, according to Pew Research Center, while wages have shown some upward growth — due to inflation over the last 40 years — real purchasing power has actually moved very, very little.
“After adjusting for inflation, however, today’s average hourly wage has just about the same purchasing power it did in 1978, following a long slide in the 1980s and early 1990s and bumpy, inconsistent growth since then. In fact, in real terms, average hourly earnings peaked more than 45 years ago: The $4.03-an-hour rate recorded in January 1973 had the same purchasing power that $23.68 would today.”
Inflation — which has been at historic lows for the last several years — has started showing some signs of growth again. Core inflation spiked 2.9 percent over the last 12 months, essentially flattening wage gains that had edged into the last several months’ economic reports. Not to mention, as the Fed has two interest-rate increases planned by the end of the year, the uptick of inflation is likely to persist.
Adding to the fun, consumers born in the 1980s to 1990s (aka millennials), who are widely counted as the future of the economy, carry the highest debt load of any generation, according to the Federal Reserve Bank of St. Louis. In research from by Raj Chetty, professor of economics at Stanford, generation Sriracha has about a 50-50 shot of outearning their parents in their lifetime — and that 50-50 shot is an optimistic read of the situation for anyone born into a household with parents who earned less than $100K per year.
“The millennials whose parents belong to the 1-percenter club will be fine, thanks to receiving a great education at the top schools and nabbing one of the high-paying jobs that go along with having that pedigree,” Karen Webster noted in a commentary on the Coming Millennial FinTech Crisis. “But those living in middle-class families — those whose household income is between $50,000 and $100,000, or 50 percent of the U.S. population — fare much worse. Only 44 percent of those kids have the prospect of making more than their middle-class parents. And for the 29 percent of the U.S. population earning less than $50,000, the prospects are very grim.”
That extra $70K sure sounds like it would come in handy. So, debt-laden and unlikely to outearn their parents — not exactly a cheerful situation. And one that seems to fit rather uncomfortably with the rising debt figures.
Bigger Debt Loads (And More Trouble Covering Them)
U.S. household debt continued to increase in the second quarter, propelled by an advance in mortgage borrowing, according to a report by the Federal Reserve Bank of New York, which also noted a decline in seriously delinquent student loans.
American’s increased the amount of money they borrowed in the second quarter, with consumer borrowing reaching $13.29 trillion during the quarter ending in June, the NY Fed found. All in all, consumer debt during the second quarter was up $454 billion from a year ago, marking the 16th quarter in a row in which consumer debt increased.
Digging around under the hood a bit (as PYMNTS and Unifund have done in the July 2018 Financial Invisibles report), there is some reason to feel a bit of apprehension over the consumer credit profile. More than a third of consumers report falling behind on bills, up 6 percent from this time last year, in an economy that has been booming with inflation rates below 2 percent for more than eight years. As Karen Webster pointed out, these are not “Geez, I forgot to pay the credit card bill since I was away for a week” late payment the bills situations.
She said, “No, this is different and more concerning — telltale in an era when auto bill pay makes paying bills automatic, and being late can reflect a conscious decision to delay or skip a payment entirely.”
The “who” behind those late bills are probably not who one would expect. According to the PYMNTS/Unifund results, those with some of the highest incomes and educational levels are among those with the most precarious financial circumstances.
In fact, the most at-risk group — by the numbers — is the demographic segment termed “Second Chances,” who have had financial troubles in the past and are working to rebuild and re-establish themselves as good financial citizens. These folks, on average, are roughly 42 years old and earn $63,000 a year. Sixty percent of them own their own home and are employed full-time. Forty-one percent have college degrees, 66 percent have credit cards and 77 percent report they are better off or the same, financially, as they were last year.
All sounds good, until hearing this statistic: 79 percent of them report living paycheck to paycheck. And it gets more worrisome from there.
Half say their monthly bills are larger than their monthly income, with the other half reporting that, most of the time, bills outweigh their monthly income. Around 50 percent also say they will either fall into delinquency by 22 percent or struggle to pay 28 percent of their bills three months or less from now. The financial “Shut Outs” — those who are unable to use mainstream financial services due to past difficulties — have a more positive outlook on their financial future, only 7 percent of whom expect to face a similar uptick in delinquencies over that same timeframe.
Those “Second Chances” make up 27 percent of all consumers.
Don’t Panic (Or Wear Rose-Colored Glasses)
While it might be easy to take the above data and determine the end is near, that is probably an overreaction. As we said, the data is complicated. The household debt rate has hit an all-time high, but delinquency levels are not worrisome as of yet.
“While overall delinquency rates have remained stable at relatively low levels, transition rates into delinquency have fallen noticeably for student loan[s] over the past year, reflecting an improved labor market and increased participation in various income-driven repayment plans,” said Wilbert van der Klaauw, senior vice president at the NY Fed, reported Reuters.
Loans that are seriously delinquent — 90 days or more past due — were at 2.3 percent in the second quarter, flat with the first quarter of 2018. The number of student loans that are turning seriously delinquent fell to 8.6 percent from 8.9 percent. Mortgage debt hit $9 trillion in the second quarter, which is up $308 billion from last year’s second quarter, but those mortgages went primarily to prime buyers — with credit scores north of 750. The average credit score reported for the U.S. consumer is 695, with a third of the population stating that their own score had improved over the last year.
In addition, Americans seem to be saving more funds than normal. According to the Bureau of Economic Analysis, in the first quarter, the personal savings rate estimate jumped to 7.2 percent from 3.3 percent. The new estimate surpasses the 6.5 percent average rate since 1990 and is nearly three times more than the low of 2.5 percent seen back in 2005. In the first three months of 2018, The Wall Street Journal reported that $613.5 billion in additional savings was amassed. Savings rates have been climbing consistently since 2013, despite unemployment falling by close to half, and home and stock prices rising by a lot.
“There’s a little more frugality,” JPMorgan Chief U.S. Economist Michael Feroli told The Wall Street Journal. “Maybe people are a little more cautious, a little more aware that there can be rainy days.”
That is a trend that is incidentally reflected in the PYMNTS/Unifund data.
The “On the Edge” credit persona — the group that has access to credit, but doesn’t use it because they don’t like it or want to use it — is looking pretty solid. Fifty-three percent own a home and 41 percent are college-educated. Seventy-one percent of the “On the Edge” personas claim they are better off financially this year versus last year, though 36 percent report working full-time. Nearly 7 percent like and use credit cards regularly. Despite being college-educated, only 5.4 percent report having student loans. And finally, only 43 percent of them said they live paycheck to paycheck and 57 percent said they save money.
They are ready, it seems for that rainy day — a rainy day that is almost certainly coming, since even a bull market that has run for nine years, five months and 13 days must come to an end someday, and though the experts looking at the current trends believe the bulls in today’s markets still have lots of legs left in them. But stop they will, at some point (the bear always makes it out of the cave eventually), though it probably — hopefully — won’t look like 2008 when the music eventually stops.
Until then, those debt markets and those “Second Chance” consumers? They are probably worth keeping an eye on.

We’re always on the lookout for opportunities to partner with innovators and disruptors.
Learn More