It took over a decade to do it, but new data from PYMNTS confirm that Amazon ended 2021 with a larger share of U.S. retail spending than rival Walmart. Thanks to a burst of fourth-quarter activity, the Seattle-based eCommerce leader now claims a 9.4% share of retail buying in 2021 versus the 8.6% portion held by the nation’s top operator of physical stores.
The change in leadership and the current 0.8% spread between the two retailers is significant on several levels, mostly because it marks the first time that Amazon has pulled ahead of Walmart in more than a decade of sales analysis and research.
For the record, PYMNTS’ sales figures strip out non-retail revenue generated from Amazon Web Services and instead calculate the gross merchandise value of items sold, including items sold for third parties where only a small percentage (typically 10-15%) of those sales is calculated as revenue.
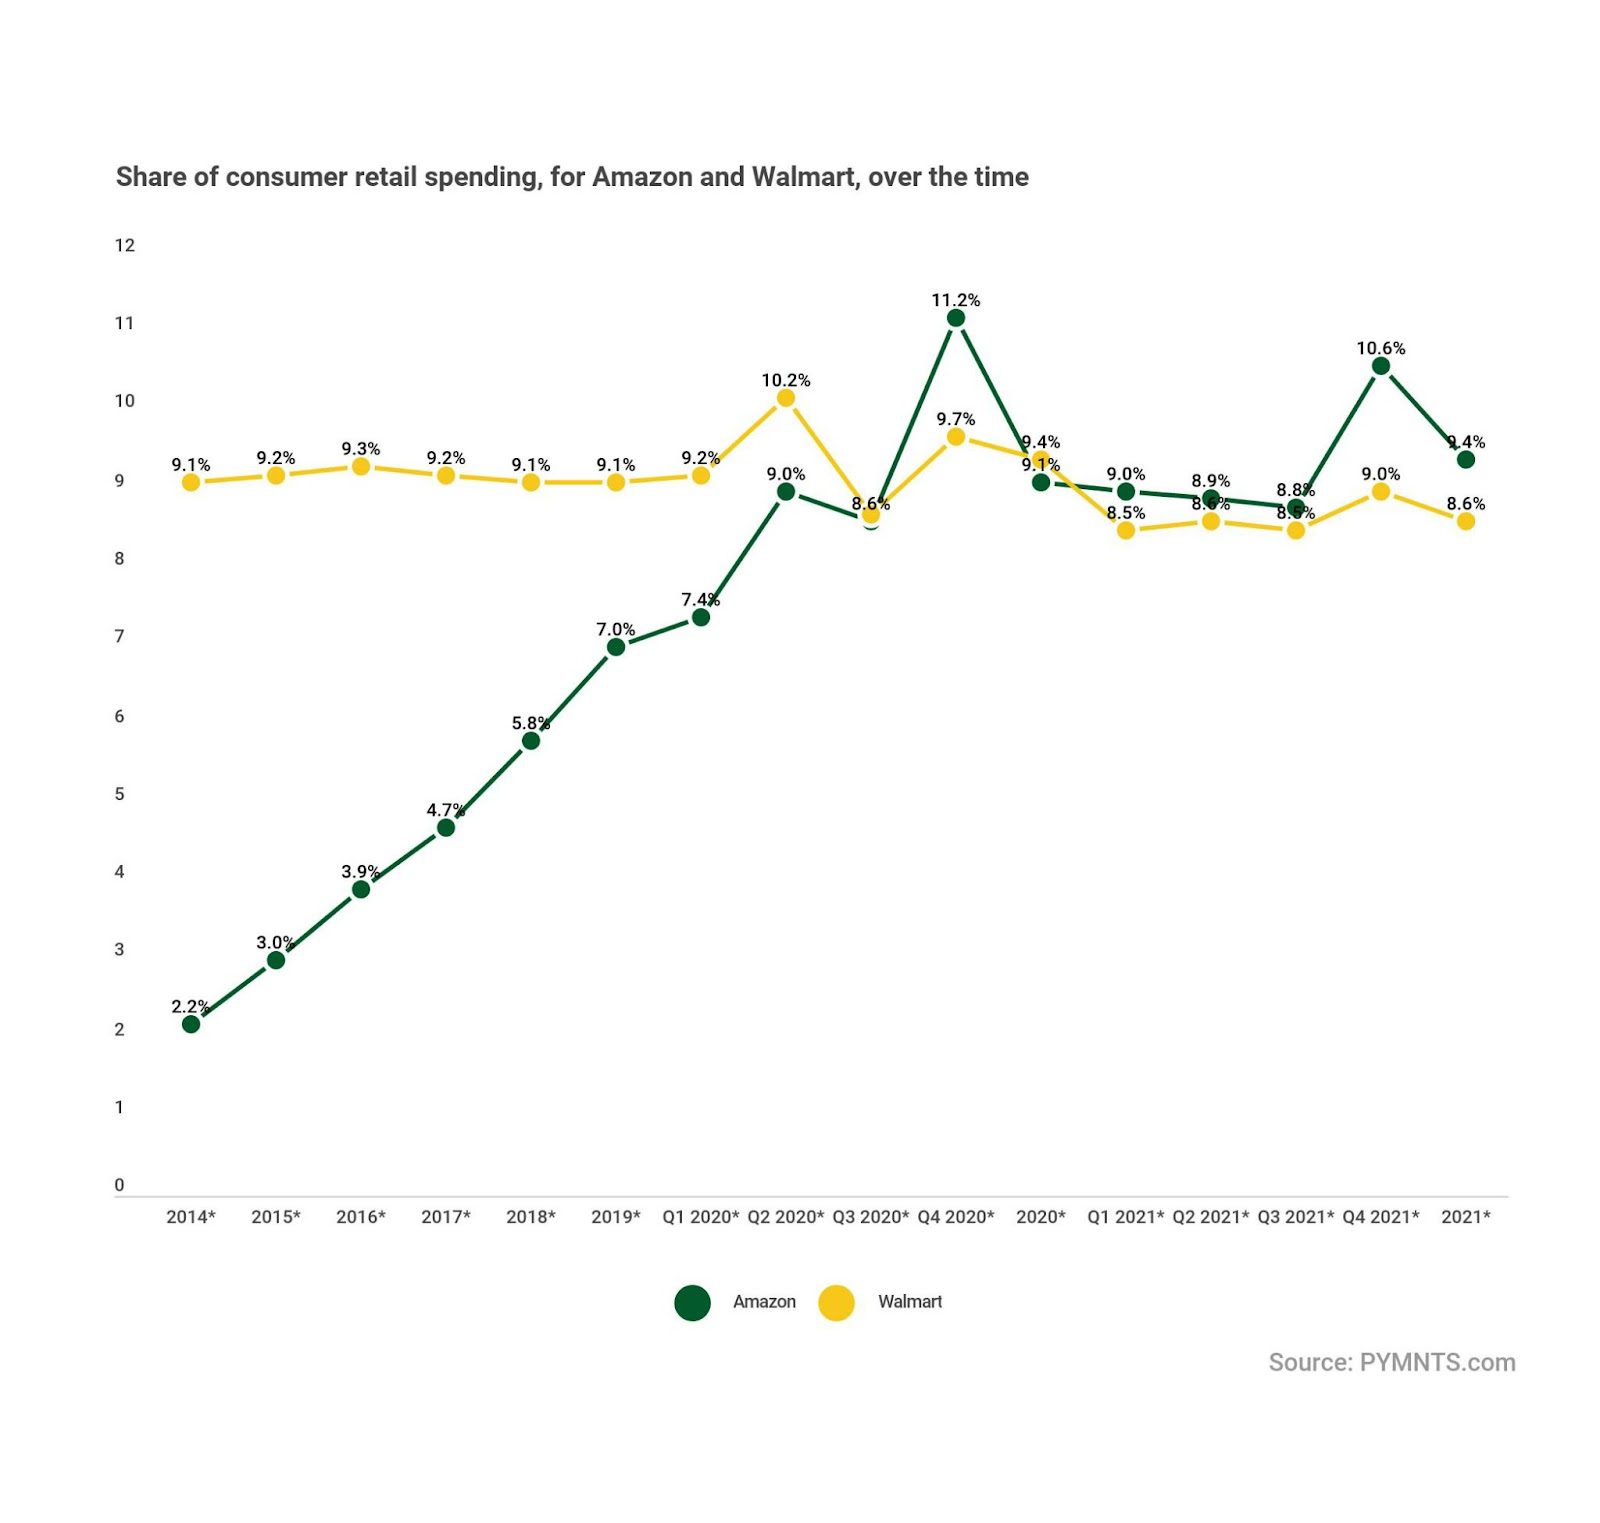
At the same time, it is important to note that Amazon didn’t pull ahead as much as Walmart slipped behind. This was after the pair were locked in a statistical dead heat a year ago when the operator of nearly 5,000 U.S. stores was still clinging to a slight 0.3% lead in what was a 9.4% vs. 9.1% share race for 2020.
However, with the help of a big 10.6% share of retail sales in Q4, compared to Walmart’s 9.0%, the online giant’s full-year tally was driven higher and left it with a comfortable lead of 0.6%.
As the above chart shows, as recently as 2014, Walmart enjoyed more than a 4-to-1 advantage in its share of consumer retail spending over its younger, digitally native rival.
Said another way, the 9.1% share of retail sales that Walmart claimed in 2014 has barely changed over the past seven years, whereas Amazon’s stake has more than quadrupled during the same period.
The Bigger Retail Picture
According to PYMNTS’ data, the typical U.S. consumer spent about $71,000 last year, roughly 38% of which (or $28,708) went to retail purchases, with the remaining 62% spread out housing, utilities, healthcare, restaurants, telecom and half dozen other non-retail categories.
See also: Amazon: Consumers Buy Clothes, Toys and Decor on ‘Record-Breaking’ Black Friday
Within the retail slice of the pie, PYMNTS breaks down spending into seven different categories, including auto parts, furniture and home furnishings, food and beverage (groceries), health and personal care, electronics and appliances, clothing and apparel, sporting goods, hobby, music and books and other retail.
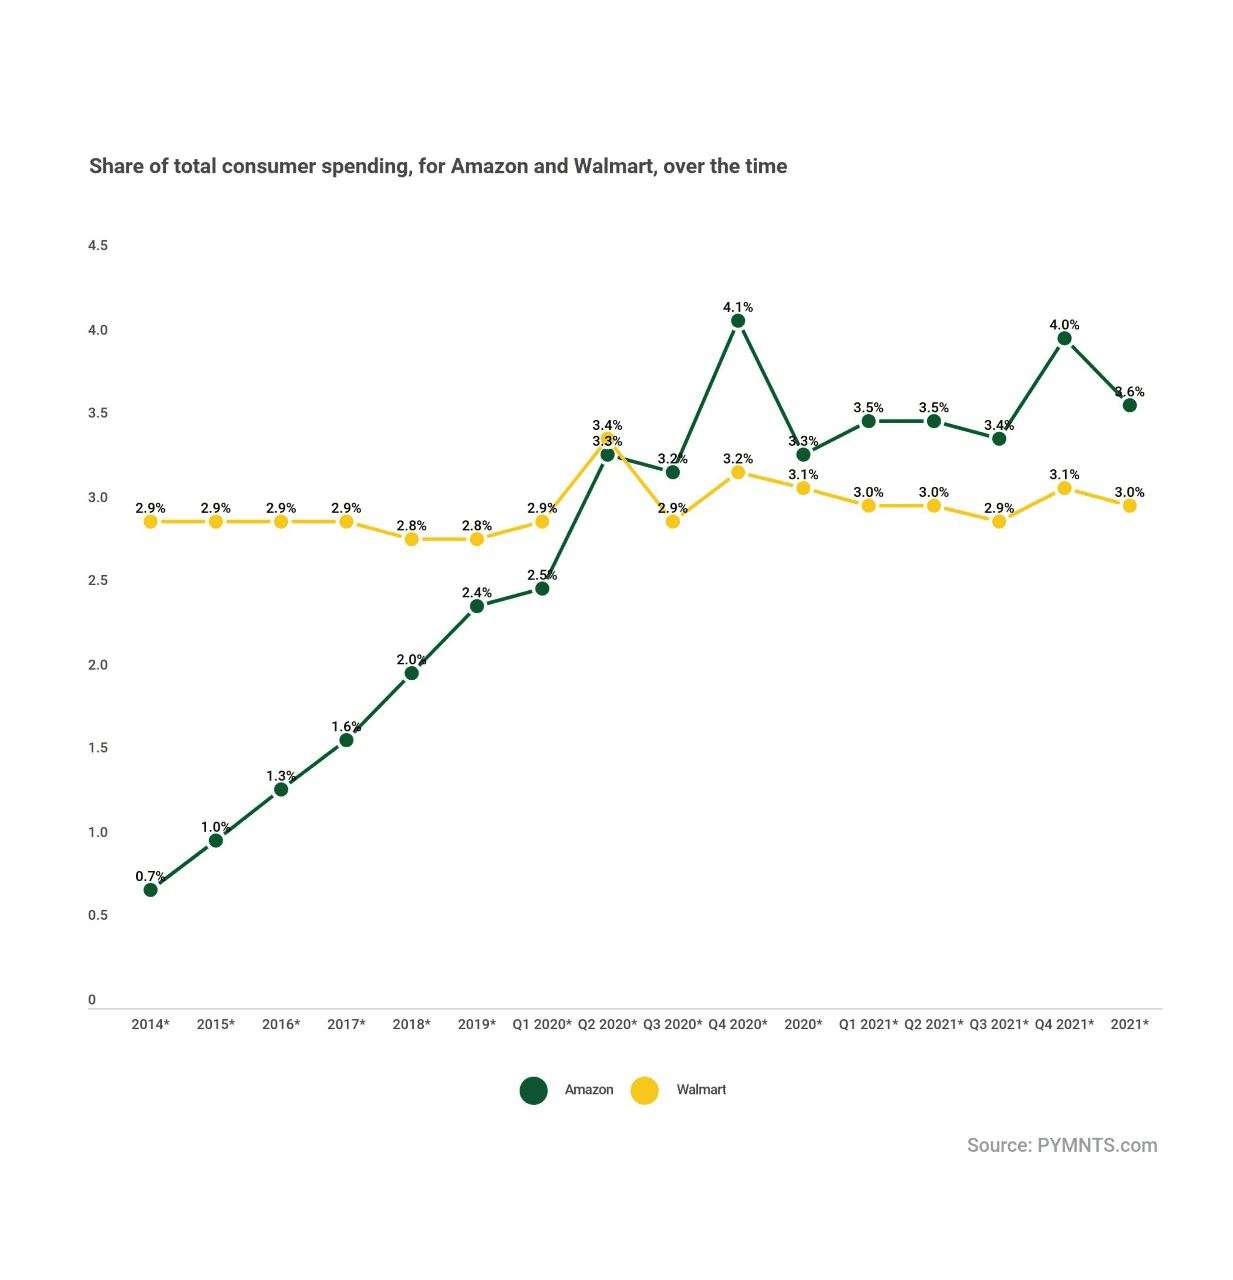
By those measures, as the chart below shows, Amazon and Walmart currently have a 3.6% and 3% share of every dollar consumers spend. In the case of the former, Amazon’s share is up slightly from a year ago, in the case of the latter, it is down one tick from the 2020 figures.
See also: Walmart’s Choose My Model Helps Shoppers Try on Clothes Virtually
Again, the long-term trend shows Walmart essentially flat since 2014, while Amazon’s share of consumers’ wallets has steadily grown, from less than 1% seven years ago to its present 3.6% stake.
The Front Line Is Food
Within those seven retail categories, nowhere is the battle bigger and more intense than in groceries, where Walmart’s 9-to-1 lead over Amazon in its 18.6% share of Food & Beverage sales is as strong as ever.
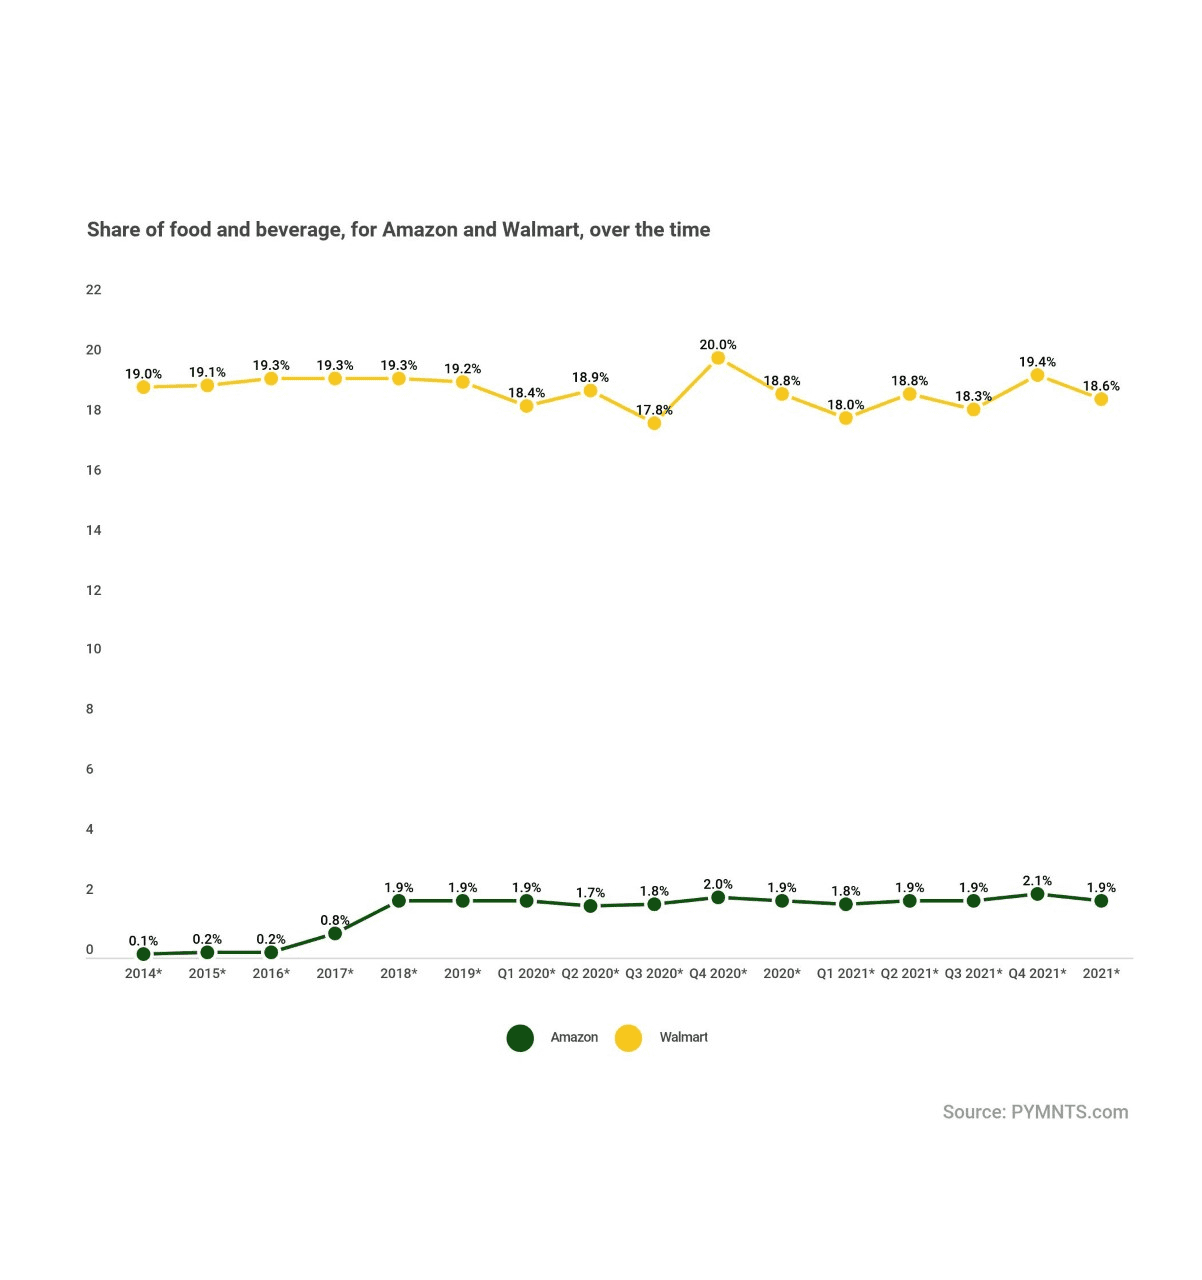
According to PYMNTS research, Amazon’s food and beverage sales grew almost 13% last year, rising to $27.4 Billion from $24.3 Billion in 2020, reflecting a 1.9% share.
For its part, the new findings show that Walmart did $264 Billion in grocery sales last year — far and away its single-largest category accounting for 56% of its total revenue — which marked about $20 Billion or a 7.6% annual increase in sales.
It’s a fight that both retailers are heavily invested in for different reasons, with Walmart determined to maintain its lead in its most important segment and Amazon so far failing to make its Whole Foods acquisition and newer launch of Amazon Fresh stores a formidable challenger to the category leader.

We’re always on the lookout for opportunities to partner with innovators and disruptors.
Learn More