Amazon now captures more spending than Walmart in five of seven retail categories, extending its reach from electronics and apparel into health and personal care. That breadth gives Amazon several ways to grow as consumers shift more purchases toward goods they can research, order and have delivered without visiting a store.
The September 2026 PYMNTS Intelligence report, “Amazon Takes Five Categories as Walmart Tightens Its Grocery Grip,” finds that Amazon gained spending share in every category tracked during the second quarter. Its share of total U.S. retail spending reached a record 9.6%, compared with Walmart’s 7.5%.
We’d love to be your preferred source for news.
Please add us to your preferred sources list so our news, data and interviews show up in your feed. Thanks!
The report, part of the “Share of Wallet: Amazon vs. Walmart” series, draws on company earnings reports and federal spending data. Amazon’s overall lead widened to 2.09 percentage points, roughly twice the gap a year earlier. Think of the seven categories as lanes on a track: Amazon is ahead in five, while Walmart maintains a substantial cushion in groceries.
Three findings show where Amazon’s advantage is strongest and where it’s gaining ground:
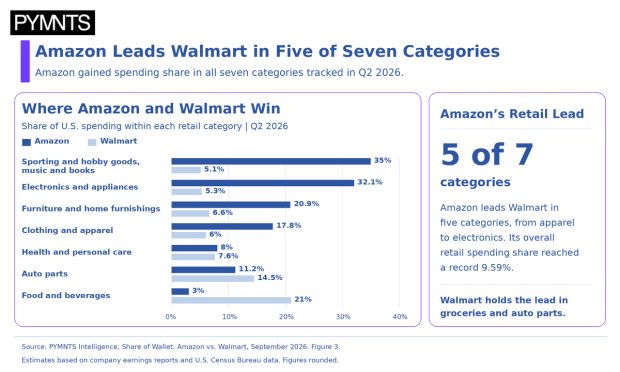
- 35% of spending in sporting and hobby goods, music and books went to Amazon, compared with 5.1% to Walmart. This combined category produced Amazon’s largest lead over its rival. Electronics and appliances followed closely: Amazon captured 32.1% of spending, versus Walmart’s 5.3%. Both categories fit purchases that consumers can make at their own pace, often after comparing products online.
- 9% of furniture and home furnishings spending went to Amazon, compared with Walmart’s 6.6%. Amazon also captured 17.8% of clothing and apparel spending, versus Walmart’s 6%. These advantages show how widely its position has strengthened. In furniture, Walmart held a small lead in 2019. Amazon’s lead reached 14.3 percentage points in the latest quarter, extending its advantage in purchases that don’t require a store visit.
- 8% of health and personal care spending went to Amazon, edging past Walmart’s 7.6%. The narrow lead adds a fifth category to Amazon’s column. Walmart held a slight advantage a year earlier. This category sits closer to the boundary between planned online orders and purchases made during a regular store trip, giving Amazon another opening beyond its strongest discretionary categories.
The broader spending picture offers room for both retailers. Retail’s share of total consumer spending stabilized at 31.3%, while categories typically suited to ordering reached 24% of retail spending, up from 21.1% in 2019. Walmart still captured 21% of food and beverage spending, compared with Amazon’s 3%, and led in auto parts.
For retailers, the findings offer a useful guide to serving shoppers: make planned purchases easy to order and give regular store visitors reasons to return.
At PYMNTS Intelligence, we work with businesses to uncover insights that fuel intelligent, data-driven discussions on changing customer expectations, a more connected economy and the strategic shifts necessary to achieve outcomes. With rigorous research methodologies and unwavering commitment to objective quality, we offer trusted data to grow your business. As our partner, you’ll have access to our diverse team of PhDs, researchers, data analysts, number crunchers, subject matter veterans and editorial experts.
See More In:
Amazon, Amazon vs Walmart, Consumer Spending, data point, featured insights, Featured News, News, Payments Intelligence, PYMNTS Intelligence, PYMNTS News, retail spending, Walmart


 Add as Preferred Source