The early bird used to get a supplier discount. These days, it may still be waiting for the customer to pay. Across North America, more businesses are receiving payments on the due date and rethinking when they can afford to pay their own bills.
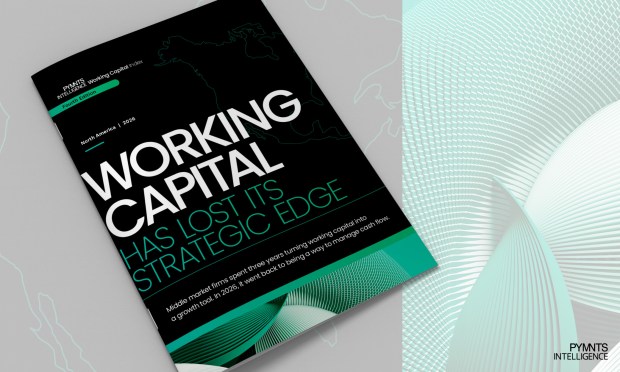
PYMNTS Intelligence produced The Working Capital Index, Fourth Edition, “Working Capital Has Lost Its Strategic Edge,” and retained full editorial control over its findings. The Index draws on a July 2026 survey of 120 CFOs and treasurers at U.S. and Canadian firms with annual revenue of $50 million to $1 billion. It compares their answers with three prior editions from 2025, 2024 and 2023.
The Year the Due Date Became the New Normal
Customers didn’t stop paying. They stopped paying early. Two-thirds of receivables now land exactly on the due date, and seven in 10 firms say they no longer know which week their money will arrive. Middle-market firms pay the way they’re paid, so when early money stopped coming in, it stopped going out. Early payment went from standing policy to something a supplier has to earn.
Firms Borrowed to Cover the Gap
Use of external working capital reached 83%, and 61% of firms now stack two or more solutions. Bank lines of credit and corporate cards rose. Term loans fell. For the first time since 2023, cash flow management and emergencies beat growth as the reason to borrow, 45% to 38%. Firms borrowed more in a year when borrowing got cheaper. The timing of cash, and how little they could count on it, drove the decision.
Predictability Became the Edge
Every top performer uses AI in treasury. So do 97% of bottom performers. Tools no longer separate the tiers. What does is 70% of top performers report financing needs that stay constant through the year, against 3% at the bottom. Their cash cycle runs 39 days against 63. And they’re the only tier reporting clear returns on AI at scale because they let the tools act on a forecast instead of just producing one.
We’d love to be your preferred source for news.
Please add us to your preferred sources list so our news, data and interviews show up in your feed. Thanks!
What’s Inside “Working Capital Has Lost Its Strategic Edge”:
- The first reversal in the Index, and the four behaviors behind it.
- How the receivables squeeze traveled from customers to suppliers.
- Why revolving credit beat term debt in 2026.
- Where savings went, and why bottom performers spent theirs buying back the behavior they gave up.
- The top performer scorecard: What separates the tiers, and what no longer does.
- What CFOs and treasurers say they want from their banks, in their own words.
About the Index
The fourth edition of the PYMNTS Intelligence Working Capital Index draws on a July 2026 survey of 120 CFOs and Treasurers at U.S. and Canadian firms generating $50 million to $1 billion in annual revenue, compared against three prior editions covering 842 North American firms. The Index is a 0 to 100 score built from the behaviors most associated with reduced days payable outstanding.
See What Separates the Firms That Kept the Edge
The playbook is in the report. The tools are already in your treasury.
See More In:
accounts payable, accounts receivable, B2B, B2B Payments, cash flow management, featured insights, liquidity, Main Feature, News, Payments Intelligence, PYMNTS Data Lab, PYMNTS Intelligence, PYMNTS News, PYMNTS Study, supplier payments, treasury

 Add as Preferred Source