It is estimated that 69.6 percent of all carts are abandoned, which translates to $200 billion in lost revenues.
Retailers have implemented solutions like follow-up emails, innovative verification and security measures and stored payment to reduce friction.
In the Q1 2019 Checkout Conversion Index, PYMNTS assesses the site features online merchants offer on desktop websites, mobile websites and mobile apps and assigns index scores based on how seamless the checkout experience is. The average score in Q1 2019 was 50.9.
Mobile checkout appears to have gotten rockier over the past year. The top 30 merchants’ mobile channel index score measured at 85.7 in Q1 2018 and fell to 80.3 in Q1 2019.
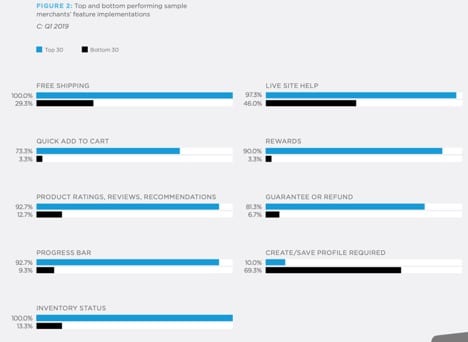
Since Q1 2018, the gap between the top and bottom performers has narrowed. This is a result of bottom performers adding features while the top performers are removing some.
For instance, in Q1 2019 nearly half (46.0 percent) of the bottom 30 performers offered live site help. In Q1 2018, around one-third (34.7 percent) did. None of the bottom performers offered quick add to cart in Q1 2018 and now 3.3 percent do. The number of top 30 merchants that offer product ratings, reviews and recommendations shrunk from Q1 2018 to 2019. All of them offered those features last year, while 92.7 percent do now.
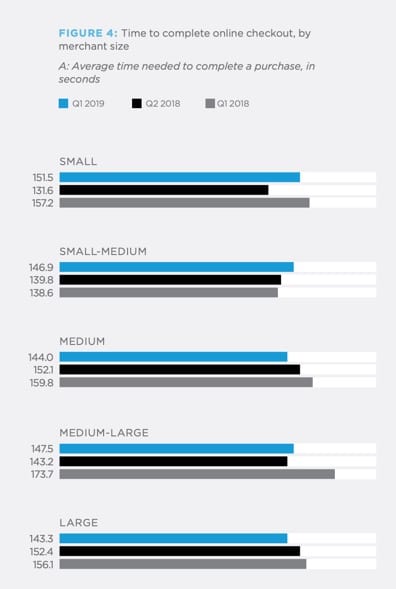
In Q1 2019, small merchants brought checkout time down to 151.5 seconds from 157.2 seconds in Q1 2018. In Q1 2019, larger merchants have shrunk checkout time 12.8 seconds year over year. Large merchants also reduced the number of clicks to checkout, from 24.4 in Q1 2018 to 21.4 in Q1 2019.
Since index scores are related to ease of checkout, higher index scores often correlate with speed. But this doesn’t seem to be the case with larger merchants. Their overall index score fell from 62.9 in Q1 2018 to 58.8 in Q1 2019.
This is because like the top performers, large merchants removed some site features in the past year; 81.0 percent offered free shipping in Q2 2018 and in Q1 2019 only 74.2 percent did. In this case, expected features have more impact on experience than speed.
It wasn’t just the size of the merchant that affected index scores. Different industries also played a role. In Q1 2019, the highest scores belong to home improvement and hardware (59.4), computer and electronics (58.3) and health and beauty (58.0).
Gaming, delivery services, subscription retail, marketing and other software services and books, music video and entertainment scored the lowest in Q1 2019 and this was also the case in every quarter since Q3 2017.
Subscription commerce isn’t just for meal kits and beauty boxes — the concept has been adapted to ridesharing services, food delivery and wardrobe-building. But it’s easy to see why the industry received low checkout index scores (36.1 in Q1 2019). Sites aren’t always transparent about costs and recurring membership fees, which could cause users to flee without converting.
Food delivery services often tack on extra fees in the checkout process, so users can get an unwelcome surprise when the total cost of order can double from what they originally thought. Services like Uber Eats, Grubhub and Postmates have recently started adding additional small cart fees.
The theme of this Q1 2019 report was that online retailers should be cautious about site features they decide to eliminate, if any. Free delivery, guarantees and refunds can be costly for even large retailers and top performers but saving on these investments can come at a price. Meanwhile, the smaller retailers have stepped up and are reaping the rewards.
Among the 64 online retailers whose scores changed the most from Q2 2018 to Q1 2019, those that experienced increases had added at least one of the checkout features, including mobile optimization, quick add to cart, rewards, a guarantee or refund policy, security logos, a progress bar, inventory status, free shipping, product ratings and reviews and/or site live help. In Q1 2019, the features with the highest impact on scores were free delivery and inventory status; 75.6 percent of retailers that added free shipping and 75.0 percent of those who added the ability to check in-stocks experienced increased scores.
Not surprisingly, the online retailers whose scores shrunk had removed at least one of these same features.